SEABED SURVEYING & FOUNDATIONS: Special tools map the Black Sea's deepest towed survey
Editor's Note: This article is a summary of "Survey Operations for the Blue Stream Project" (OTC 12071) presented by Brian Beard and Christian Tobias of NeSA B.V. at the 2000 Offshore Technology Conference in Houston, Texas, May 1-4, 2000. This summary appears with permission.
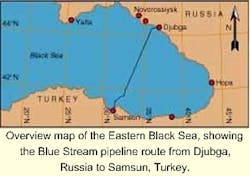
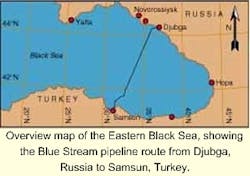
At the request of PeterGaz, NeSA per-formed a detailed geophysical survey with a remotely operated vehicle (ROV) along a 380-km long proposed pipeline route crossing the Black Sea from Djubga (Russia) to Samsun (Turkey) in water depths up to 2,150 meters. This survey was known as Step 2 of Gazprom's Blue Stream Project Phase II. The survey was conducted in cooperation with the ROV company Canyon Offshore and vessel owner Diamar. The Italian DP-vessel Mare Oceano was used for the data acquisition during the period May 15 to Sept-ember 19, 1998.
Phase I of the Blue Stream Project revealed that pipelines could be installed insofar as pipeline stress criteria were not exceeded. The review of the Phase I survey results indicated the following potential geohazards:
- Slope failure and movement mechanisms on the heavily canyoned Russian continental slope
- Potential instability and unpredictable bearing capacity of the surficial sediments on the abyssal plain
- Sliding, slumping, and mass gravity flows on the Turkish continental slope and the possibility of tectonically induced slope collapse
- Instability of the seabed due to gas seepages and faulting activity on the Turkish continental shelf.
Geohazards
The potential for geohazards along the route required further investigation by means of a detailed geophysical survey. The main objectives of the detailed geophysical survey were:
- To finalize the preferred routing for two pipelines within the corridor
- To gather high resolution bathymetric and geophysical data required for detailed pipe-line design
- To quantify and delineate potential geohazards
- To provide site specific information required for seismic risk analysis.
In order to achieve these objectives, a high-resolution multibeam echosounder, side scan sonar, and Chirp sub-bottom profiler were mounted on an ROV to reduce the water column height between the sensors and the seabed. This resulted in increased data accuracy and density, as well as provision of visual inspection capabilities.
The proposed route alignment was defined within a nominal 1,000-meter wide corridor, reduced to individual route options of a minimum 400-meter width at the approach of the Russian continental shelf. During the Phase II Step 1 survey, detailed bathymetry and geophysical surveys were performed on the Russian and Turkish continental shelf areas, using vessel mounted multibeam echosounder and towed side scan sonar and sub-bottom profiler. During the Phase II Step 2 survey, detailed ROV surveys were performed in the critical sections across the Russian and Turkish continental slopes and at discrete locations over the abyssal plain.
The navigation, bathymetry, and geophysical data were processed and interpreted immediately onboard the Mare Oceano to allow adjustments in the survey lineation in case inaccessible or hazardous terrain was detected for pipelines. Final interpretation and charting of the bathymetry and physical data along the pipeline routes was performed by NeSA in their office in Rotterdam, The Netherlands.
Geomorphology
The geomorphology observed along the Blue Stream pipeline route can be divided into seven distinct provinces:
- The Russian shelf has a flat and smooth surface with a general inclination of 0.4° toward the shelf break. It can be subdivided into the coastal slope (inshore part) and coastal platform. The coastal slope extends from the coastline to the 50-meter depth contour, showing current ripples in a NE-SW direction. The coastal platform is situated in the 50-100-meter depth contours. The very distinct shelf break marks the transition to the continental slope and coincides with the 100-meter depth contour.
- The Russian continental slope is characterized by a highly dissected, dendritic drainage pattern of ridges and canyons. Near the top of the slope, the steep V-shaped canyons have a mean width of 15-80 meters. These canyons widen downslope into broad, flat-bottomed U-shaped valleys over 1,000 meters in width.
- The Russian apron is defined by a number of ridges and intermediate submarine valleys in an east-west alignment parallel to the coastline. The ridges are remnants of an anticlinorium and can be regarded as a continuation of the Western Caucasus structure. The water depth deepens gently from 1,900 meters to 2,110 meters.
- The abyssal plain is a horizontal, extensively flat area with a seabed gradient of less than 1:1,000 and a general water depth of 2,130 meters. A maximum water depth of 2,150 meters was observed.
- The Turkish apron shoals gently from 2,140 meters to 1,945 meters, toward the foot of the Turkish slope. A submarine channel, with a relative depth of 40 meters and a width of about 4.5 km, crosses the surveyed route.
- The Turkish continental slope has a convex morphology, reflected where the slope gradient becomes progressively steeper from 1° at 300 m depth to 14° at 1,100 m depth.
- The Turkish shelf can be divided into three distinct sub-areas: plateau, terraced slope, and shore approach. The plateau extends over a distance of 24 km and overlies the Mid Black Sea Ridge. The terraced slope extends over a distance of 15 km and has a mean slope gradient of 0.9°. A break in the seabed topography marks the transition between the terraced slope and the shore approach. The water depth shoals at 30-35 meters with an average gradient of 0.5°.
Survey systems
The above-mentioned seabed geomorphology was surveyed in detail during Phase II Step 2 of the Blue Stream Project.
- ROV: The high resolution geophysical data was acquired via survey sensors fitted on a Triton XL-20 ROV. The ROV was flown at a height of 25 meters above the seabed during detailed survey operations. A line spacing of 100 meters was adopted to have 100% overlap with the adjacent survey lines.
- Multibeam echosounder: A 3,000 m depth rated Reson SeaBat 8101 multibeam echosounder transducer was manufactured with titanium housing for this project. The SeaBat has an operating frequency of 240 kHz.
- Side-scan sonar: GeoAcoustics SS941 side scan sonar transducers were installed on the front-port and front-starboard side of the ROV. The side-scan sonar could be operated at a frequency of either 114 or 410 kHz. Excellent results were obtained using the lower frequency.
- Sub-bottom profiler: A GeoAcoustic Geo-chirp CP931 sub-bottom profiler was installed on the ROV. This system is four transducers, mini-streamer hydrophone (eight elements), electronics bottle, and transceiver. The transmitted signal has a frequency of 1.5-11.5 kHz, with a sweep length of 32-ms and a power output of 400 W.
- Subsurface positioning: Of paramount importance was the requirement for accurate subsea positioning. At the time of the survey, no similar projects had been undertaken. A Sonardyne (L)USBL system was used in the event that LBL would be necessary and a system was installed on the Mare Oceano. The responder is depth rated to 4,000 meters and has a pulse width of 10 ms. The maximum repetition rate is two acoustic pulses per second and the operating frequency ranges in between 20 kHz and 30 kHz.
- Gyro compass, motion sensor: At contract award, we were unable to acquire either a gyro or a motion sensor off the shelf to operate at the expected depths. A Robertson SKR82 gyro was used and we had a grade-316 stainless steel housing manufactured. A TSS DMS-05 motion sensor was installed in a purpose built T-6061 high grade aluminum housing.
- Doppler log: An RDI WM-300 Navigator Doppler velocity log was installed on the aft side of the ROV. It has four transducers, which transmit acoustic pulses at a frequency of 307.2 kHz with a power of 25 W.
- Altimeter: The ROV and TMS were equ-ipped with Tritech P A-200 altimeters. The ROV altimeter has a very wide receiver band and therefore suffered greatly from interference caused by the multibeam echosounder and the Doppler log. The unstable altimeter readings meant that the ROV was producing lots of thruster noise, when it was operated in "auto altitude flying" mode. This was overcome by modifying the RTSX software to take the Doppler log string and out-put the Doppler height to the Triton XL-20 control computer.
Conclusions
The reliability and repeatability of the sensors employed in the survey is demonstrated by the fact that the ROV survey consisted of 2,313 underwater hours over a range of depths from 100 meters to 2,150 meters, during which the system sensors had no breakdowns. The techniques employed also show that the three vital sensors necessary for geohazard surveys - multibeam, sub bottom profiler, and side scan sonar - can all be acquired simultaneously from an ROV at these water depths.
For deepwater work, special attention should be paid to the complete survey system integration. Using Doppler data effectively is critical to the accuracy of surveys of this nature. The teams of multi-talented personnel were essential to the project's success.


