Mark J Kaiser & Siddhartha Narra,Center for Energy Studies, Louisiana State University
In 2017, oil and gas production in the Gulf of Mexico (GoM) in water depth less than 400 ft generated approximately $3.9 billion in gross revenue, $2.8 billion from oil sales and $1.1 billion from gas sales.
As long as the net revenue generated by a structure is greater than its direct operating cost, the structure will likely continue to produce. For mature fields, operators seek scale, synergies, and service alliances to reduce regional expenses and consolidation helps to lower cost on a unit production basis.
In the fourth part of this series on shallow-water GoM structures, a snapshot of the revenue and production statistics of the producing, idle, and decommissioned inventory circa 2017 are described. Circa 2017, there were 886 producing, 662 idle (formerly producing), and 4,303 decommissioned structures in the shallow-water GoM. The article concludes with some of the factors that impact investment decision-making for mature properties.
Revenue
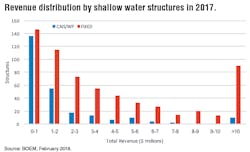
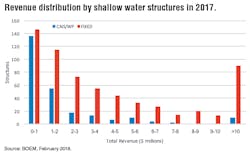
Oil producers generated about $2.8 billion in total revenue in 2017, or on average about $5 million per structure. Gas producers generated $1.1 billion in total revenue, or about $3.4 million per structure.
Half of the producing inventory generated $2 million or less during 2017, about one-third of the inventory generated less than $1 million, and about 20% of structures generated less than $500,000.
Structures generating half a million dollars a year are still economic since most are unmanned and part of regional operations where labor and logistics costs are shared and allocated across a portfolio of properties. However, once revenues fall below a minimum threshold and cash flows are no longer adequate to cover costs, operators will find it increasingly difficult to maintain production.
Most of the revenue generated from oil and gas production on the shelf is from the top quartile of producers, and platforms hosting multiple wells dominate production.
Oil production generates about three-quarters of the revenue for shelf assets and for the average oil structure, associated gas contributes about 10% of sales revenue on an aggregate basis. For the average gas structure, liquids play a more sizeable role in sales revenue, ranging from about one-third if condensate prices are equal to crude oil prices, down to about one-fifth if condensate is priced at a 60% discount to crude oil.
In the US Gulf Coast, condensate is normally priced between 40 to 60% crude oil prices, while casinghead gas may be priced at a 25 to 50%+ premium relative to gas well gas depending on market conditions. Associated gas is worth more than gas well gas because in the reservoir it will have ‘picked up’ heavier hydrocarbons which are subsequently stripped out and sold as valuable NGL streams.
Total primary production
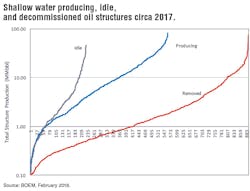
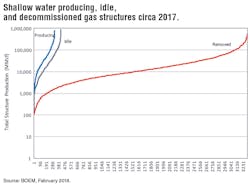
Total primary production (i.e., oil for oil structures, natural gas for gas structures) is shown for all shallow water oil and gas producing, idle, and decommissioned structures circa 2017.
Only the primary product is depicted so that natural volume units (barrels and cubic feet) are used instead of heat-equivalent units, but the shape of the curves and conclusions are essentially unchanged with heat-equivalent units. Structure counts run along the x-axis. Cumulative production by structure on a log scale is depicted on the ordinate.
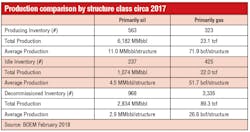
Producing oil structures extracted in total 6.2 Bbbl of oil through 2017, which for an inventory of 563 structures, represents an average cumulative production of about 11 MMbbl per structure. Idle oil structures have produced about 1.1 Bbbl of oil through 2017, or an average 4.5 MMbbl per structure, and decommissioned oil structures have produced in total 2.8 Bbbl of oil or about 2.9 MMbbl per structure.
Producing gas structures extracted 23.1 tcf through 2017, or about 72 bcf per structure, while idle gas structures produced 22 tcf, or 52 bcf per structure.
The inventory of decommissioned gas structures produced the largest volume of gas among the three structure classes at 89.3 tcf, but on an average structure basis is the smallest among the three classes. A similar ranking hold for oil structures.
The average production per structure class is lowest for decommissioned structures and highest for producing structures.
Future dynamics
What will the aggregate production curves look like in five or 10 years assuming status quo conditions and current trends?
When a structure stops producing it will ‘jump’ to either the idle inventory curve or directly to the decommissioned curve depending on the decision of the operator. This will increase the structure counts on those curves by one and by bringing along its cumulative production will expand the receiving curve to the right and upward and change its shape while shifting the producing inventory curve to the left by one and shrinking its production volume.
In recent years, the number of new installations in shallow water have been much smaller than the number of structures that cease production, and assuming this trend continues in the future, the producing structure curve will continue to shrink and shift left over time.
Note that the producing oil curve falls to the right of its idle curve while the gas producing curve falls on the left of the idle inventory curve having already made this transition and indicating a more limited future potential.
Idle inventory will expand or shrink depending on the annual net change of transitions, expanding right if additions are greater than decommissioning, or moving leftward if annual additions are less than decommissioning. Idle structures are fed by those structures that stop producing and are reduced by decommissioning, but eventually all the structures will be absorbed in the decommissioned structure inventory.
The decommissioned structure inventory can only grow in size in both number and magnitude since decommissioning is an ‘absorbing’ final state that picks up structures from both producing and idle inventories and does not return any structures. The decommissioned structure curve will shift right and up over time.
Mature properties
Oil and gas wells never actually deplete their reservoirs, but other factors – low product prices, high operational costs, financial problems, or the lack of resources to characterize the reservoir and identify the potential for additional recovery – will influence decision-making and investment opportunities.
Historically, large well-financed independent producers have entered into fields previously operated and owned by the majors, and after additional production, assets were sold down the food chain ending with smaller operators working off the cash flows from producing wells and unable or uninterested to workover idle wells.
Mature fields may still have potential but since they are presumably marginal targets a special effort is required to pursue these high-risk, small-upside opportunities. Operators often require economies of scale to balance the risk from these investments.
