Visualization technology speeds field development
Faster 'targeting' reduces cycle time and hole problems
Sheldon Harbinson
Landmark Graphics Corp.
The physical properties of today's complex reservoirs have a significant impact on wellbore placement, and ultimately on field production. These complexities can also lead to delays in designing direc-tional plans for individual well paths and multi-well field development. Because of the environ-ment and asset team requirements, the planning process for generating path plans can require weeks.
null
Over the last 20+ years, many directional planning technologies have been developed to automate the planning process. Geological complexities and engineering constraints have limited these technologies to quickly plan for entire field developments, whether brownfield, or new field. The number of required iterations between geoscience and drilling engineering personnel often delays the planning process.
Field development path planning
The increasing complexity of subsea environments and the need for cost reductions have helped drive technological developments. Directional planning is a large part of field development planning. Historically, directional planning software has focused on optimizing individual path plans while avoiding collisions with other wellbores.
The technology was meant to generate a mechanically drillable well path from which directional drilling service companies could realistically expect to be successful. Essential in the past, it is even more essential today as these wellbores become more complex. However, these tools are not always designed to accommodate subsea hazards, complex fault structures, detailed seismic information, or most importantly, complex reservoir models.
These software tools are generally not capable of designing path plans for multiple wells in an entire field at the same time. The tools are still important for refining path plans for technical constraints, as engineering concerns must be considered.
Visualization can play an important role when asset teams go through their field development planning workflows. This value has resulted in the development of new technologies. The technical requirements to use all of this path planning information are significant, especially considering the design and decision process that must become a part of building these path plans.
The technical requirements that operators face have resulted in numerous challenges:
- Long field planning cycle times
- Increasing complexity of the fields being developed
- Increasing volumes of relevant data from numerous sources.
These data may be good, but ultimately, the data are not as useful as they could be with integration. The challenges identify a need for applying advanced visualization technology to path planning. Visualization technology has progressed significantly over the last 10 years. The ability for all members of an asset team to evaluate the same subsurface data simultaneously on a desktop PC is a reality today. The next phase is to use this information more effectively and achieve what asset managers are all striving for: better, faster decisions that increase production.
In many situations, path-planning cycle time is increasing, not decreasing. This is primarily a result of increasingly complex subsea environments with more faulting, sea floor hazards, or a need to tie into existing infrastructure. Some of the fields being developed today require days or weeks of path planning just for a single wellbore.
Geoscientists place targets on a mapped production horizon or on a reservoir grid. If the targets are placed on the horizon, they are not necessarily in the optimum part of the reservoir. If the asset team has built an accurate reservoir model, they can identify the best places for these targets. The challenge then becomes placing the targets in the best grid cells to optimize reservoir drainage. The time required to create a target list can be days or weeks.
The asset team then provides a list of target coordinates to a directional planner who optimizes the mechanical wellbore design and path to prevent wellbore collisions. The path plans are then passed back to the geoscientists, who further evaluate them for fault intercepts or other potential hazards. It is not uncommon for modifications to pass back and forth a number of times. In fact, the number of iterations between geoscientists and path planners can exceed 20. The cycle-time for designing a wellbore can be days, even after targets are identified.
Going one step beyond a single well, the challenges involved in designing several wellbores become even more time consuming. If target locations are generated without using all available information, i.e., using existing infrastructure in a brownfield development, a multi- month process can easily result in avoiding wellbore collisions and maintaining the mechanical constraints of the downhole tools.
The increasing number of complex environments leads to asset teams having more information at their fingertips. However, this information is not always in meaningful or integrated formats and can complicate the decision-making process. Integration is the key to resolving this problem.
An operator's greatest challenge involves evaluating the flood of information pertinent to the planning design. Information relevant to individual disciplines now becomes relevant to all members of the asset team. Geophysicists focus on their seismic data and interpreted horizons while reservoir modelers focus on the grids they have built.
Field development planning requires that each discipline be accountable for the integration of information from the other members of the asset team. However, having the data from other asset team members available does not make it understandable. Since we all process visual information more readily, the key to making the integrated information meaningful is visualization. Our ability to "understand" the subsea environment will improve significantly as a result.
Why visualization?
The challenge of reducing cycle time for field development path planning can only be overcome using an integrated visualization environment. Until recently, powerful visualization tools had only been available on high-end computer hardware. Today, reasonably performing desktop PCs allow asset teams to take full advantage of all of the information available to them.
null
Information that can affect path plans includes seismic data, existing well and log data, fault information, reservoir grids, surface images showing geographical data, and sea floor pipeline images. Even some forms of data that are not generally used in these environments can have an impact on field development planning:
- Fault grids can help to avoid hole problems caused by drilling
- Reservoir grids are important for target picking and for target ranking
- Surface images can be important if there are environmental concerns with specific geographical areas
- Sea floor images can show hazards, like shipwrecks and pipelines, which must be avoided.
These are just a few examples that illustrate the importance of using visualization tools in the planning process. Planning around objects is considerably more difficult if users cannot visualize them.
Targets in 3D space
Target definition usually includes a location in 3D space but does not include any reference to the actual reservoir being exploited, even if the target location was picked using a reservoir model. Visualization components and techniques automatically target on a reservoir grid and visually locate individual targets or electronically import targets.
The most advantageous of these techniques is the auto-targeting on a reservoir grid. The quickest process, it can provide the more accurate targeting method.
null
Once the model is built, targets are ranked according to porosity or permeability and placed on the areas of the reservoir having the greatest porosity or greatest permeability, or on any other predetermined reservoir model property. This information can be combined with basic drainage pattern information and vertical offset to accommodate uncertainties around oil/water contacts. As the targets are auto-created, the user can see where they are located in the grid and in reference to other subsea data.
Placing targets accurately also needs to include drainage patterns and any existing targets or wellbores already in place. The ability to visualize existing wellbores, platforms, and other infrastructure greatly simplifies the design process.
Brownfields
Brownfield development can present significantly more challenges than new fields. Tying into existing infrastructure might provide the economic benefits necessary to develop a field. While this may seem like a simple matter, accounting for existing wellbores introduces several complexities.
Issues to be addressed include collision avoidance, mechanical well path design constraints, adequate coverage of the available targets, appropriate number of pads or platforms to achieve this coverage, hazard avoidance (pipelines, faults, etc.), honoring existing targets/wells drilled, and preferred drilling direction. Some of these issues are relevant in new-field development but become more difficult when including offset wells, as new path plans must honor existing wellbores and targets for drainage purposes, and avoid collisions.
As in target definition, well paths for field development planning are normally carried out individually to honor all of the previously mentioned constraints. This requires much iteration between members of the asset team. It can result in a cycle time of weeks or months for a typical new-field development plan and even longer for brownfield development.
DecisionSpace
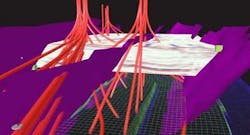
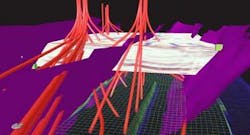
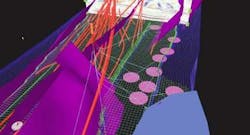
A field development path planning workflow using the DecisionSpace environment involves visualization of several components. These components, running on a desktop PC, include a reservoir grid, seismic data, mapped horizons, faults mapped from seismic, and existing infrastructure such as wellbores, targets, and platforms.
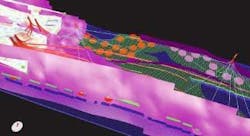
In the high-end, PC-based earth model visualization planning environment, the AssetPlanner tool allows users to create and place targets automatically in areas of the reservoir with the best porosity, greatest permeability, or oil saturation, depending upon what properties have been built into the model.
The targets are ranked following the decreasing levels of porosity or oil saturation. Targets are created only if they meet the constraints established by the asset team.
null
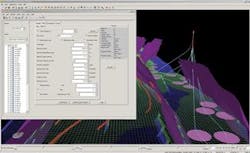
With the targeting workflow established, the number and placement of pads or platforms, or pre-existing platforms are optimized using the field development path planning application. The results are very dependent on mechanical constraints that the user places on the individual well paths. Minimum kick-off depth, maximum angle, and maximum reach are just some of the examples.
The PC-based visualization planning system can also optimize numbers of well paths based on whether multi-target wells and multi-lateral wells are required. For example, if multi-lateral wells are chosen, the system determines if targets can be reached from current well paths, or if a multi-lateral leg needs to be drilled off of a well path. From this point, each leg becomes a planned well path from which subsequent multi-laterals can be planned. For environments where wellbore stability is an issue, users can input a preferred drilling direction.
Taking advantage of the visualization capabilities, users can "drag" the platform to a more appropriate location if there are pipelines or environmental concerns. From a visualization standpoint, this is a powerful method for immediately developing a modified set of wellpath plans. An alternative to dragging platforms to avoid hazards is to designate geographical regions, pipelines, or even faults as hazards. The system automatically determines the most appropriate location for the platform while avoiding wellbore collisions.
Using all of the constraints, the visualization planning system develops an overall plan that minimizes the total measured depth. Asset teams can run through different path planning scenarios and obtain results for reservoir drainage in a matter of hours or days, rather than weeks or months.
What is the next step in this process? Integra-tion with surface pipeline network models will allow for another improvement in the field development planning process. Not only will field development path planning tools such as this auto-create targets and path plans, but production and facilities constraints can become a part of the workflow. The result will once again be a very significant cycle-time reduction.
