Market size is crucial to survival of non-exclusive data business
PART II: This is the second of a two-part series on the business of non-exclusive seismic data and the licensing contract controversy created by the recent wave of industry mergers.
A private survey of the geophysical industry to determine the sizes of the non-exclusive data libraries around the world was undertaken by the authors. Contributing to the project were the following companies (alphabetically): Baker-Hughes, CGG, Fairfield, Schlumberger, SEI, Seitel, TGS-NOPEC and Veritas DGC. The results of the industry survey, which does not include company-specific data, are presented in this report.
The timing of the capital investment and accumulation of the data libraries was estimated based on records of crew activity levels, and detailed data related to Schlumberger's own activity and levels of investment. The estimated recent data volumes are considered accurate, while old data volumes and growth rates probably have an accuracy of +/- 10-15%.
According to the author's survey, 3.4 million km of 2D non-exclusive data have been acquired in the major marine basins of the world, with 1.2 million km acquired in the US. The large majority of the data was acquired in the past two decades.
An estimated 829,000 sq km of 3D non-exclusive data have been acquired in the most important marine basins of the world, of which 485,000 sq km are in the US. Substantial 3D data libraries have also been acquired along the transition zone (TZ) and onshore in the Gulf Coast basin, and in a few other basins of North America. The North America land and TZ 3D libraries total over 59,000 sq km.
To compare 2D and 3D statistics, the 3D data may be converted to CDP line-km by multiplying by the number of CDP line-km per sq km. By this calculation, there are over 28 million line-km of 3D non-exclusive data in the world.
Over the past two decades, the US Gulf Coast Basin has been the most important basin in the world for investment in non-exclusive data, followed closely by the North Sea. Third in importance has been the West African continental shelf, from Angola through Nigeria.
Offshore basins in Asia, Australia, and onshore western Canada have seen significant steady investment over time. Today, offshore Brazil is the focus of the most intensive effort in new non-exclusive data acquisition in the industry's history. Eastern Canada is also very active today with both 2D and 3D non-exclusive surveying, and the deepwater Gulf of Mexico (GOM) continues to be active.
Capital investment
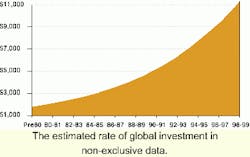
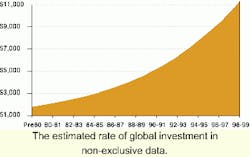
The geophysical industry as a whole is estimated to have invested $11.4 billion in non-exclusive data libraries worldwide over the past four decades. Of the total, some $1.5 billion (estimated) was invested during the 1960-1970 period. This is the least accurate of the estimates. We estimate (more accurately) that some $9.9 billion was invested in the 1980s and 1990s, and that of that amount, $6.4 billion was invested in the 1990s alone.
The rate of capital investment by the industry increased in the mid-1980s with the 2D seismic model, but then increased dramatically in the 1990s. The rate of capital investment in non-exclusive data worldwide increased non-linearly throughout the 1990s. The annual rate of capital investment in non-exclusive data in 1999 is over five times what it was in 1980.
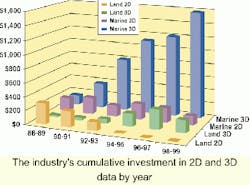
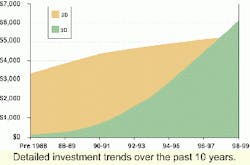
By separating 2D and 3D seismic, this increas ed rate of investment is more pronounced. In slightly over 10 years, the industry's cumulative investment in 3D data surpassed its cumulative investment in 2D data spread over a period of four decades.
Note the industry's reaction in 1998-99 to the downturn in terms of investment rates in 3D marine data, versus 3D land data. While the rate of investment in land data slowed significantly, compared to the prior period, the rate of investment in marine data increased dramatically.
At the same time that the global volume of non-exclusive data has exploded, the price of the data to the user has fallen. If one compares the 1990 license cost to acquire a 30 block 3D proprietary survey (three-streamer/dual source), versus the 1999 license cost of acquiring 30 blocks of non-exclusive 3D data (six-streamer), there has been a 1,000% price improvement to the user.
This gain has come roughly half from technology advancements and half from the non-exclusive business model itself. If one considers the unit price for a large volume license purchase, then there is as much as a 15-to-1 improvement.
Today, the fortunes of the geophysical industry are dependent in large part on the non-exclusive data business. The fortunes of the exploration business are as well. Only through continued investment in new data, and new technology, can finding and recovery costs continue to fall and efficiency improve.
Inexpensive seismic data - both 2D and especially 3D - delivered via the non-exclusive model, has had several side effects:
- Significantly lowered the entry barriers to regional exploration
- Enabled independents to enter new markets at minimal risk
- National oil companies and their governments now accept 3D seismic concession work commitments in the form of non-exclusive data licensing
- Several countries encourage non-exclusive data investments by offering better terms to seismic contractors than to oil companies.
Business economics
The non-exclusive data business is governed by three key measures: risk, return on investment (ROI), and internal rate of return (IRR). In a global portfolio, data owners will mix low risk investments in an ideal basin like the Gulf of Mexico, with higher risk investments in areas like Asia or Alaska. A good return at a good rate on some surveys pays for the sluggish performance or outright failure of others. The capital put at risk by the owner is equal to the cost of the data less any pre-sales that can be secured.
Data Cost = Owner Investment + Pre-funding
If an owner achieves a 30-40% pre-funding level, he then carries 60-70% of the cost and risk himself. In practice, the risk levels can range from 0-100% of cost. The non-exclusive data business is based on making multiple sales of a survey, with each sale priced at some fraction of the cost of creation. Therefore, the critical investment parameter is the number of sales of the data that can be expected to occur (Nfs = number of full sales).
Revenue = (Nfs) (Average Sales Price)
The timing of sales determines the amount of capital initially put at risk by the owner, so revenue is considered in terms of pre-sales and late sales.
Revenue = Pre-Sales + Late Sales
Pre-sales control the initial risk taken by the owner, and late sales produce the return on investment.
Market size
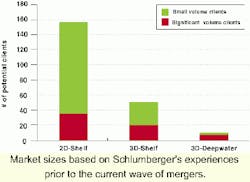
Estimating Nfs is the key to risk assessment. Several factors affect the estimate. The most important of these is market size. In the Gulf of Mexico (GOM), there are well over 100 clients who license non-exclusive 2D data. Prior to the current frenzy of mergers, there were 50-60 companies that licensed 3D non-exclusive data on the shelf, perhaps 25 of which licensed data in significant quantities. On the other hand, in deepwater there were perhaps 8-12 clients licensing significant quantities of data.
When considering a new hypothetical deep water 3D seismic investment in the GOM, an owner would first make an estimate of the number of companies with a high, medium and low probability of licensing data out of the total deepwater market. For each of these, he would estimate a most likely volume of data licensed.
By adding these probability-weighted sales estimates, the owner can estimate Nfs. The owner would then price the data to ensure recovery of his investment and an acceptable return at an acceptable rate. With the current wave of mergers, the market size in deepwater is approaching the lower limit of acceptability.
Market factors
Market size is, in turn, controlled by several related factors: geology, land, and market consolidation:
- Geology: The US GOM is highly structured by salt tectonics and growth faulting. It is full of reservoir and seal sediments at all levels with dozens of plays. Different companies applying new data and new ideas have made new discoveries repeatedly in the same areas. This attracts a large pool of competitors. In some other basins, a single play type in a single interval may dominate exploration activity. Far fewer competitors will likely participate in such a basin.
- Land: The US GOM enjoys a stable political climate, a simple regulatory system, annual area-wide lease sales and a fair and transparent bidding process. Lease blocks are small and turnover is rapid. Many companies can and do "share the pie" as a result. In other basins, in other countries, the process of securing land rights can be daunting, and only a few companies can successfully compete. In areas where land is leased in huge blocks, and does not turn over periodically, the chance for late sales is greatly reduced, and/or delayed, thereby increasing risk and preventing an acceptable rate of return.
- Market Consolidation: An owner makes an estimate of the number of probable sales of a proposed new survey based on the market size. With the risk assessment performed, an investment is made and the license fees are set. If two probable licensees in the market merge, then the number of probable sales drops by one, which may be a significant percentage of the total probable sales.
In the late 1980s, a case involving Tenneco focused the industry's attention on the need to clearly prohibit license transfers. This, coupled with the industry's dramatically increased rate of investment in the 1990s, led to the amendment of the IAGC model license contract to ensure that a company could not acquire a data license except by purchasing it from the owner. Generally, a data license terminates in the event of a merger, acquisition, or effective change of control of the licensee, unless the acquiring company or surviving entity agrees to pay a license fee (transfer fee).
Since this contract provision was generally adopted by the industry, billions of dollars have been invested in non-exclusive data. With the unprecedented wave of merger activity now sweeping the industry, this contract provision is of vital importance to data companies. After the merger activity has settled, the industry must re-examine its historic levels of investment in the face of a substantially reduced global market.
Alternative business models
To justify investment in high-risk non-exclusive surveys in situations where the market size may be small and/or the unit cost of data very high, some companies have experimented with alternative business models. In simplified terms, these models are attempts to manage the risk of a new data investment by sharing the potential reward of the licensee's exploration and production activity. In most cases, this involves some form of production payment or success bonus paid by the licensee to the data owner, in addition to a license fee. For the data owner, this changes the revenue equation as follows:
Revenue = (Pre-funding + Late Sales) + Other
For the past several years, the industry has engaged in a vigorous debate over the ethics of equity-taking by service companies in general. The financial results of this equity experiment are not yet clear, and the industry remains divided.
The future
Technology will continue to be a major factor in the non-exclusive data business. Shear wave and 4C (four-component) marine seismic are beginning to be acquired under the non-exclusive model. 3D/4C marine surveys record the full vector seismic wavefield. These surveys must be recorded with ocean bottom cable equipment and have the ultimate goal of direct quantitative estimations of lithology and pore fluids.
Four-dimensional seismic (4D) is also being acquired in a non-exclusive mode, but by coincidence rather than by design. As older 3D surveys are overshot by newer competing datasets, the successive 3D datasets can form the basis of 4D comparisons.
Since the non-exclusive business model is now very well developed, any new frontier basin that opens for competitive exploration to a large market can be explored very effectively and quickly. A good example is Brazil.
Non-exclusive data drives, and is driven by, the industry's appetite for new exploration. With the dramatic consolidation underway in the industry, and the apparent increasing focus on reservoir management and optimization, the trend in global exploration activity may be downward for the next several years. If so, the rate of non-exclusive data collection should also slow. The non-exclusive business model will remain significant in the industry and will continue to evolve and take new forms.
Non-exclusive data at the turn of millennium is truly the exploration tool of choice. The quality and value for money of modern non-exclusive data is exceptional.
Furthermore, the revenue generated by non-exclusive licensing is presently the lifeblood of the geophysical industry. It pays for research and development, which in turn assures the vital efficiency gains needed for future exploration.
As the industry moves toward integrated-answer products, rather than individual services and commodity products, more and more forms of data and information may very well be conveyed under some form of use-license, following the non-exclusive data model.
The future of the geophysical industry and its continued capital investment in new data, and the future of exploration business depend upon fair licensing terms being understood and respected by all licensees of the data. It also depends upon a healthy market to support the business. The wave of consolidations will eventually settle. When it does, the geophysical industry must be ready to offer the tools needed for exploration in the new millennium, using business models, which convey real value to the licensees, and real profits to the investors.;
Editor's note: This is a summary of a paper presented at the IAGC Conference in November 1999 (Houston).
