Real-time reservoir management a new paradigm for enhanced productivity
Helen O'Connor
John Sherman
Landmark Graphics Corp.
Real-time reservoir management capabi-lities for the upstream E&P industry are advancing rapidly. Most, if not all, major oil companies have task forces focused on creating the next-generation oil field - intelligent well technology, 4D/4C seismic, downhole surveillance capabilities, increased process plant automation, and Internet-enabled interfaces to create a real-time, remotely oper-ated, and digital oilfield environment.
Real-time reservoir management is key to making timely business decisions and will help drive increased business efficiency throughout the field development lifecycle. This in turn will translate into competitive differentiation and shareholder value. With such a scenario in mind, here is what a field operation might look like.
8:00 a.m. Monday
It is a typical summer day in the Gulf of Mexico, and, to the passengers on a helicopter, the production platform they are approaching looks like any number of similar facilities that dot the water. However, this is the hub of a real-time oil field.
The production platform sits astride a deep-water field. There are 20 wells, each producing at a high rate and each one critical to maintaining the producing rate. The two joint venture operators now face the rising production expenditures that have been with the industry since 1999. In response, the partners have combined key technologies in field automation, systems integration, immersive visualization, and remote operations to Web-enable the field and support real-time operations and decision-making.
10:00 a.m. Monday
As the helicopter passengers move through the platform, the application of digital monitoring technology is evident. The drilling foreman monitors measurement-while-drilling (MWD) and logging-while-drilling (LWD) data through a visual display panel, while production field engineers visually monitor production data as it is collected from Scada systems. Video monitors show service company engineers, who are consulting remotely from onshore centers, as they work with the field engineers.
Unseen but critical is a data and information hub that supports real-time data collection, aggregation, and analysis. The center of the hub is located onshore in a secure hosting facility linked to the platform's data collection centers. The underlying data management system is designed for multi-client use, ensuring secure and timely connection for the partners and their service companies to view pertinent subsurface data. By using standard forms of field data for transfer and storage, incoming real-time data are available alongside stored earth model interpretations to provide a dynamic reservoir model.
1:00 p.m. Monday
To monitor reservoir depletion, the geoscience asset team and the hosting facility acquire 4D seismic on a regular basis. The latest survey has been quality checked and loaded into the data management system. Entitlements have been set to allow access for the team, composed of geophysists, geologists, and engineers from both operators.
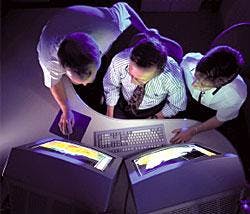
The team assembles in their visualization room onshore. One geophysical expert is located remotely and is linked via videoconference.
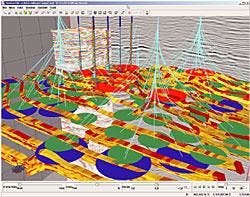
The team "logs on" to the asset from their control stations. The 4D survey is accessed and they check the traces and amplitude distributions. Once satisfied that they can use the data, a Web request is sent to download the new survey into their visualization and interpretation system. On the screen, the subsurface comes to life in 3D. Rendering within a certain amplitude range to sequence through the seismic volumes, the team studies the effects of gas production from the reservoir over time. Next, they turn their attention to the faults. A semblance attribute will highlight discontinuities and is calculated in seconds.
The team finds what they believe to be a bounding fault not previously visible. A single mouse click brings a different view of the reservoir to the screen. As the team works, they update the workflow deliverables outlined for them in a Web-based portal. While they work, anyone from other parts of the company or partners will be able to see their results via the Internet.
4:00 p.m. Monday
The asset team has now been working in the onshore visualization center for several hours. A partner meeting will be held in two days, and, based on what the asset team has seen, they will need various depletion scenarios: without pressure maintenance, gas injection, and water injection. All must be tied back to the existing platforms if their discovery is to be considered.
Using advanced decision-support software, the boundary conditions for the subsurface model are defined, and well targets and paths generated automatically. Costs are calculated for the development scenarios. Monte Carlo simulations using the most likely uncertainties for these scenarios are also run to provide net present value (NPV) distributions for the project.
The team logs in to the portal and updates the last of their reservoir development workflow phases with their recommendation to the partners.
9:00 a.m. Thursday
It is three days since the asset team received data. Now, the executives are to be briefed on their technical and economic proposal for the fault block. As the partners gather around the boardroom table, the majority interest owner plugs in her laptop, logs onto the field asset, and projects the view of the reservoir for the other partners while she accesses additional supporting documents via the workflow portal.
She explains, "The asset team did between 100-300 simulation runs each on three drainage strategy scenarios. They looked at gas and water injection scenarios, as well as a scenario with no injection. In the simulation runs, they included uncertainties involving different property models, facilities and fiscal terms. In addition, they have modeled the well schedules."
She shows the production profile distributions and the supporting economic information in the form of NPV and tornado charts as she answers questions and explains the rational of the technical recommendation with this supporting data. A full development scenario would take 17 months to drill, so a proposal is made to start with one well. All parties agree and sign the approval for expenditure (AFE) form.
11:00 a.m. Tuesday, one month later
Out on the platform, the proposed well is being drilled. The drilling foreman is keeping track of his data and progress on a Web-based video display. While watching his logs, he notices something unexpected and takes another look.
At 6,000 ft, he should have seen shale, the casing-setting depth marker, and that was 100 ft back uphole. He uses the automatic alert system to inform the company engineer and together they view the historical well control data with the shared earth model and logs.
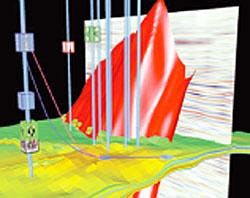
They turn to the SmartBoard, a large, touch-sensitive video display that enables them to see the subsurface environment and view historical drilling operational data as well as incoming log data. They are able to quickly see over and under the structure and compare real-time drilling data with previous wells. The historical data warns of potential problems with the casing design if they go too deep.
They log the potential issue in the workflow portal and videoconference the office engineer back onshore in Louisiana. The engineer logs in from his office; the three of them view the over-pressured zone and notice that all the other deep wells ran into problems. They will run short of casing if they drill more than 200 ft further, but they do not want to set casing too soon.
12:30 p.m. Tuesday
The engineers inform the geologist, who also has access from her office to the same applications and data. She takes control of the field desktop computer display and pulls up an amplitude trace that she drags through the current well. The operational data and the log data can now be seen in context with the subsurface model. Directionally, they are drilling on the right path, but the shale marker is just not there. Is the marker pinched out or deeper, she wonders.
Drilling further will give the geological team the data it needs to answer this question, but hole stability could be an issue. The geologist signs off so she can assemble her team to update the model and suggests the engineers watch the reservoir model for updates.
Meanwhile, the drilling engineer adjusts the casing design online from his office, which activates a Web order through the SAP software system for an additional 200 ft of intermediate casing. A confirmation is received in the field, and the three engineers conclude their conference. The foreman sets his project database to update automatically and he watches for revisions. After another 200 ft, they set casing, adapting their operations to avoid costly problems.
2:00 p.m. Tuesday
In another area on the rig, a production operator monitors production for each of the wells on his screen. Scada systems collect the data and triggers augment the surveillance process by notifying operators of performance variances.
The real-time Scada data indicates Well 15 is in decline. Production is holding steady in the other wells, so this exception is not a measurement issue. Well 15 is a SmartWell, which allows the team to check bottomhole pressures that are decreasing slightly. The engineer checks the historical pressures. He logs the inconsistency as a note in his portal and alerts the field engineer.
The field engineer conducts an initial investigation using a suite of tools to analyze the incoming Scada data visually. He checks production decline curves and notices a slightly increasing water cut. Is the issue isolated? With a few mouse clicks, he checks a bubble map of production for the field and is able to confirm a more concerning issue and decides to involve a colleague.
4:00 p.m. Tuesday
The office production engineer with one of the joint venture operators is monitoring visual displays from SmartWells in the Gulf of Mexico. He receives a message from one of his field engineers and responds that he is available, which then results in a virtual meeting. The field engineer shares his desktop to report his findings.
The office engineer investigates remedial work recommendations as he looks at the very same. Over time, he has collated production performance data from both acid wash and acid frac jobs in this field; the acid frac seems to outperform the acid wash.
He opens his economics package and begins to analyze the NPV of both workover options. From the historical data, he determines that the acid wash gives a better NPV and will provide the results needed. Within two hours, a single click of the mouse transports the economics data into an SAP request form. The request has been routed to his manager for approval and will be waiting for him when he awakes the next morning in London.
7:30 a.m., London time, Wednesday
Preparing for his last day of meetings with the London office, the production manager logs on to the Web. He accesses his portal and sees an AFE awaiting his approval. The supporting documentation is in order and he approves the request. The workover proposal will be waiting for both operating partners and the service company when they awaken in the morning, Houston time.
Conclusion
At each stage of the oilfield lifecycle, the ability to respond in the shortest possible time translates into better performance - the capability to deliver from an asset can be matched more closely to market demands for hydrocarbon resources. This capability is fuelled by the combination of people, processes and technologies, which together will bring about the paradigm shift from a calendar-based serial process to one that is parallel and real-time.
"Intelligent" fields will be those whose business critical data flows easily throughout the company and partners, as geographical and disciplinary barriers dissolve. Operating companies will have the ability to identify areas of opportunity and vulnerability and make real-time decisions about business problems to effectively manage their portfolios and improve their market positions.
Today's reality
In Houston, there is a Real-time Asset Management Center located at Landmark Graphics headquarters. Here, the combination of tech-nologies and processes to empower the people in an extended asset team, such as the one portrayed here, is demonstrated. This center is a working facility having accurate, functioning environments, including field operations, asset team visualization, partner meeting facilities, oil company office, home, hotel rooms, and a data and application hosting facility.
