Ocean-bottom survey acquisition design for 3D converted waves
Seismic objective and Vp/Vs ratio constrain survey design
C. Jason Criss
Jim Musser
GMG/AXIS
When the goal of seismic acquisition design is to record both pressure (P-wave) and converted wave (C-wave) data with the same acquisition geometry, one way to approach this issue is by using basic design principles and determining the constraining factors derived from P-wave and C-wave criteria simultaneously. A great deal of knowledge and experience has developed around 3D seismic survey design primarily associated with P-wave acquisition.
The ocean-bottom environment tends to make unique demands on the survey design process, mostly because of the different types of recording instruments and configurations available for use in that environment. However, the fundamentals of seismic survey design remain very consistent for land, ocean bottom cable (OBC), and marine streamer data. By assuming that the same fundamentals apply to C-wave acquisition as well, a systematic design approach to simultaneous P-wave and C-wave acquisition can be accomplished.
Setting goals
Understanding the seismic imaging goals for the prospect is fundamental to the survey design process. To fully appreciate the constraining factors for a survey design we will assume a very demanding and strict set of imaging goals:
- We want to record P-wave and C-wave data simultaneously with the same recording geometry
- The P-wave data and the C-wave data should be comparable from an interpretation viewpoint. We will assume this means similar subsurface coverage and similar resolution.
If we review the fundamentals of the design equations and the factors controlling the decision-making process, we can easily reduce the design problem to three simple categories: bin size calculations, offset calculations, and survey size and orientation. Availability of recording equipment (such as number of cables) and environmental or operational issues usually dictates the specific survey acquisition geometry. Other factors also impact final design, but in most cases, few factors impact the resultant geometry more than these basic principles.
Example calculation
An example of using the constraining design factor is shown using the bin size equation:
This equation relates wavelength of the seismic event to sampling theory. The velocity used in the numerator is commonly the interval velocity for the seismic wave or a root mean square velocity.
The frequency value in the denominator is the maximum recoverable frequency for the target event.
The "dip" term is structural dip (using a minimum of 30° to allow for diffractions). This equation is routine for most survey design exercises because it ties the survey design to the geological target properties from a seismic sampling point of view.
The C-wave is the constraining factor because the shear wave propagation is always slower than P-wave propagation, and it predicts a smaller bin size. The equation also predicts a relationship between sampling and the recoverable frequency. This will impact the P-wave recording by over sampling but will ensure that the geometry parameters are adequate for both types of seismic events.
Similar logic can be applied to offset requirement calculations, aperture calculations, and record length. Generally, near offsets will be constrained by C-wave parameters while far offset calculations are constrained by P-wave parameters. If one utilizes an aperture equation that includes velocity, P-wave parameters will always predict a larger aperture for subsurface sampling. This will constrain the survey size because of the slower shear wave velocities.
Strict conformity to the imaging goals prescribed previously produces a survey geometry the same size as a standard P-wave design geometry, but more densely sampled. Another issue that gets a great deal of attention in C-wave design is conversion point shift at depth. This is commonly called the common conversion point (CCP). This point predicts the subsurface sampling point for a source-receiver pair. It is always shifted toward the receiver station due to the slower upward-traveling shear wave velocity after conversion.
Depending on the depth and ratio between the P-wave velocity and shear wave velocity (Vp/Vs), this can impact the similarity in subsurface coverage on the two types of recording. Shallow depths or high Vp/Vs ratios will always be more challenging and usually require closer receiver line spacing to maintain consistent coverage. OBC design creates some unique challenges from this perspective.
OBC issues
Because of the relatively high cost of deploying and positioning cables on the seafloor and the relatively low cost and high repeatability of marine airgun shots, OBC survey designs tend to have a rather low density of receiver stations and a very high density of shots. In today's OBC market, most seismic surveys are acquired using two or three long parallel cables. The data are generally shot either with the source boat sailing along multiple shot lines parallel to and between the cables (acquiring narrow-azimuth P-wave data with trace distributions analogous to conventional to streamer data) or along relatively long shot lines perpendicular to (and crossing) the cables (acquiring wide-azimuth data distributions analogous to land survey designs).
For multi-component (C-wave) data acquisition, it is absolutely critical for the source lines to extend beyond the active receiver lines in both design cases (parallel and perpendicular) to collect continuous sub-surface C-wave coverage. This is necessitated by the shifting of the CCPs toward the receiver stations, which causes gaps in the subsurface coverage that can only be filled by overlapping the subsurface coverage from adjacent shot lines and swaths. For C-wave acquisition with parallel OBC shooting, this phenomenon requires shooting as many as three times more shot lines parallel to the cables, depending on the Vp/Vs ratio.
null
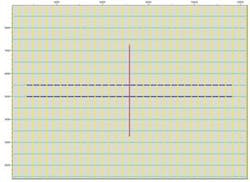
In this design, two long receiver cables are deployed with an airgun source boat recording shots (red) along lines perpendicular to the cables. The active stations (dark blue) along the cables (light blue) are rolled forward between adjacent shot lines (yellow) to maintain symmetry, and two cables are rolled between swaths in this example to efficiently acquire continuous subsurface coverage.
An important advantage of OBC recording is the de-coupling of the source boat from the recording cables. This allows efficient acquisition of split-spread data, which allows higher fold coverage, better offset distributions and stack responses, and reciprocal ray-paths for refraction statics corrections.
Deep target design analysis
In the preceding design, the receiver cables are deployed on the sea floor with a line spacing of 500 m and the shots lines are 300 m apart. The active cable lengths are 9,000 m, with the shot line centered across the cables to allow long offset data for a deep reflection target (~4,500 m deep). There are 80 shots on each shot line to provide moderately long cross-line offsets (~2,000 m) and good cross-line fold overlap for both the P-wave and C-wave data.
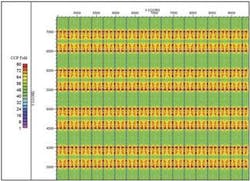
This design will acquire uniform P-wave subsurface coverage with 60-fold multiplicity for a target at depth of 4,500 m. The figure shows the corresponding converted wave CCP fold coverage for the same deep target, assuming a Vp/Vs ratio of 2 above the reflection horizon, which is not unreasonable for a relatively deep sedimentary target.
Note that while the P-wave fold is uniform, the CCP fold coverage varies with higher and lower fold stripes oriented parallel to the receiver lines. In this case, the fold varies between 37 and 80 at the target. This is caused by the shifting of the CCP reflection points away from the shots and toward the receiver lines.
For different values of Vp/Vs and for different target depths, the CCP fold coverage will also vary. The width of the fold coverage stripes parallel to the receiver lines can be made narrower by reducing the receiver line spacing on the sea floor.
null
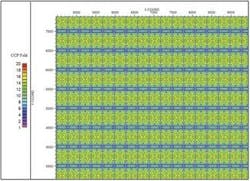
Wide-azimuth C-wave fold coverage for a target at 1,500 m with Vp/Vs = 2 produces a CCP fold between 3 and 19 at the target.
null
Shallow target design analysis
For a shallow objective at a depth of 1,500 m, the effective P-wave fold coverage will be considerably lower than that at deep horizons because the long offsets cannot be accurately stacked for very shallow targets. For the wide-azimuth design described above, the effective P-wave fold for a horizon at a depth of 1,500 m will be about 10, varying between 8 and 13.
Note that the variations in the CCP fold coverage caused by the shifting of the converted wave traces toward the receiver stations is more pronounced for the shallow objective than for the deeper objective. For the shallow case the CCP fold varies between 3 and 19, which is a factor of more than six times, while it varies between 37 and 80 in the deep case, which is a factor of just over two times.
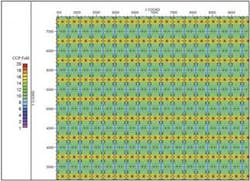
The velocity ratio of 3 is perhaps more representative of shallow sedimentary objectives because as rocks become more unconsolidated, as is typical for shallow sedimentary sequences, the Vp/Vs ratio typically increases as the shear wave velocity of the rocks decreases rapidly. In this case, the CCP fold varies from 4 to 20. The bands of lower fold coverage (the blue areas) affect a wider area and the higher fold areas (in red) are more concentrated than in the earlier figure.
For shallower horizons, the CCP fold coverage patterns are even more sensitive to the effects of higher Vp/Vs. The only effective way to improve the CCP fold coverage for such objectives is to reduce the receiver line spacing.
In general, designing OBC surveys to simultaneously acquire optimal P-wave and C-wave data requires an appropriate level of knowledge of the seismic objectives and characteristics of the geology. The concept of constraining parameters will help determine which parameters are most critical for each aspect of the data.
For instance, due to typically low shear wave velocities, the acquisition bin size (which controls source and receiver station intervals) should be computed based on the shear wave velocity. Similarly, due to typically high P-wave velocities at depth (and the fact that the C-wave ray paths that correspond to a given P-wave reflection point are recorded with shorter offsets than the P-wave ray paths), long offsets are constrained by the P-wave velocity.
Because the Vp/Vs ratios tend to be relatively high for shallow unconsolidated sediments, relatively slow upward-traveling shear wave ray paths will be shifted more severely toward the receiver lines, causing strong lineation in the shallow C-wave data coverage. The only effective way to reduce this effect is to acquire C-wave OBC data for shallow objectives with relatively small receiver line spacing. Unfortunately, this generally increases the cost of such data acquisition.
For information, contact: Jim Musser, director of Acquisition Technologies GMG/AXIS Inc.: (303) 318-7780 ext. 2217; email: [email protected].


