Life-of-field seismic system adds value to reservoir simulation of Valhall field
J. van Gestel, K.D. Best, O.I. Barkved, J.H. Kommedal - BP Norway
The frequent time-lapse observations from the Life of Field Seismic (LoFS) system across the Valhall field have provided a wealth of information. The production and injection responses can be observed through time-shift and amplitude changes. These observations can be compared to modeled synthetic seismic responses from a reservoir simulation model of the Valhall Field. The observed differences are used to update and improve the model with a better match to the historical data. The uncertainty of the resulting model is reduced and a more confident prediction of future reservoir performance is provided.
Workflows are used to convert modeled properties to a synthetic seismic response for any time range. Correlation-based match quality factor are calculated to quantify the visual differences. This match quality factor allows us to quantitatively compare multiple LoFS time ranges, well areas, and alternative models to help identify the parameters that best match the seismic observations.
Three different case studies are shown where this method has helped to reduce the uncertainty range associated with specific reservoir parameters. By updating various reservoir model parameters we have been able to improve the match to the observations and thereby improve the overall reservoir model predictability. The examples show positive results in a range of different situations, which indicates the flexibility of this workflow and the ability to have impact in most reservoir modeling problems.
Valhall field is in the southern North Sea and has been on production since 1982. More than 700 MMboe was produced during its first 25 years of production. Approximately 50% of the drive mechanism has been from rock compaction. A water injection program was initiated in 2004 to optimize recovery and to extend field life by 40 or more years.
To help monitor production and water injection performance, a full field, permanent LoF system was installed in 2003. The four-component, ocean-bottom seismic array consists of 13 cables with a total of 2,414 receivers and covers an area of approximately 45 sq km (17 sq mi). As of this report, eleven time-lapse surveys have been acquired: November 2003, April 2004, June 2004, November 2004, April 2005, November 2005, June 2006, April 2007, November 2007, April 2008, and November 2008. Additional surveys are planned twice each year.
The LoFS observations are used in various parts of the Valhall subsurface organization. The Well Delivery Team uses these time-lapse observations to select the well targets and to better define the landing location for future wells. The Base Management Team reviews the LoF observations to plan well interventions and to monitor well performance. The Reservoir Management Team uses the data to improve the predictive capabilities of the reservoir model using history matching. This updated model then is used to better monitor the waterflood, to recognize areas that are not optimally swept, and to update area depletion strategies. LoFS also is used to monitor microseismicity and well failures, and to improve the geomechanics model.
RTM modeling
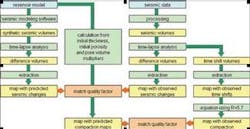
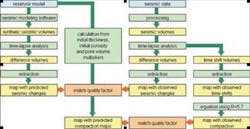
LoFS observations are integrated with the reservoir model using the workflow as shown. Synthetic seismic data are generated for multiple reservoir models using Valhall specific rock physics and seismic forward modeling software. The synthetic seismic data are processed using the same automated time-lapse analysis workflow as the recorded seismic data. These result in two identically derived amplitude difference extractions.
In the same manner, compaction maps are generated from the reservoir model to match with observed time-shift maps. Matching reservoir compaction to time-shift due to induced changes in the rock outside the reservoir requires dedicated modeling of the stress-redistributions by coupling the reservoir simulator model with the geomechanical model. However, a simplified first order match may be established using a linear relationship with an estimated R-factor. Using observations from the actual extractions and modeling usingmech2seis software the R-factor of 5.7 was found to be relevant in these cases.
The synthetic seismic data and the compaction maps are loaded into the seismic interpretation package. Images of the most important observations are generated automatically. These images can be accessed via the Web to allow for quick comparison of the observed and predicted responses.
The most important extractions are compared visually. Differences are noted and the reservoir model with the best match is identified. Since the visual inspections are time-consuming and subjective, calculation of a Match Quality Factor (MQF) is included in the automated workflow. This MQF is based on a correlation of the two maps and is similar to the Seismic Match Quality of Kjelstadli, et al. (2005). The MQF is a number between 0% (no match at all) and 100% (identical data equal perfect match).
Comparison of the MQF to the visual inspection in various areas for different extractions has built confidence that the MQF is a good measure of the match between two maps, especially on a relative scale when comparing two similar reservoir models. An automated workflow similar to the one described by van Gestel, et al. (2007) generates several MQFs for the different LoFS time ranges, extractions, and areas of interest. This allows quick comparison of a range of reservoir models in different situations. It also improves the confidence in an observation when it is supported by similar results in various parts of the field and different LoFS time ranges.
Furthermore, automation of the workflow allows for linkage with a Top Down Reservoir Modeling workflow. In that workflow, the observations are compared to a large number of reservoir models generated from a large range of parameters. The MQFs are used to automatically improve the match to the observations to decrease the parameter uncertainty space.
Case studies
This workflow is powerful when changing one key parameter and quickly observing the effect of that parameter on the resulting time-lapse responses. The following three case studies are shown with a problem description, some observations, and conclusions.
1. Confined sub-basin: The first case is a detailed sub-basin study. The advantage of this sub-basin is that it contains a limited number of wells -- one producer and one converted water injector -- which makes it easy to study the responses of each well. The water injector was converted into a water injector in May 2005 and has shown a good time-lapse amplitude response in the following LoFS Survey 6 in November 2005. For this basin, a range of 40 different reservoir models were generated with variance in several model properties such as vertical permeability, fault transmissibility, and pore volume multipliers. The 10 models with the best match to the reservoir parameters of pressure, GOR, and water cut then were compared to the observations for the sixth and seventh LoFS surveys. Both amplitude and time shift difference maps were compared. The amplitude difference maps show the most confident signal and provide the best measure of match of the various models. The lessons learned from the best matched models are ported back to the full field model. Work is ongoing to improve the match.
2. Changing gas-oil relative permeability curves: The second case study is a field wide study of the effect of changing the gas-oil relative permeability curves. Several reservoir models were generated with only the gas-oil relative permeability curve changed. The effect of this change was examined in two sub-basins for various wells and for different LoFS time ranges. The gas-oil relative permeability has a large effect on how fast the pressure declines away from the wellbore and therefore has a strong side effect on the resulting compaction. This calculated compaction can be compared to the observed compaction, which is calculated from the observed time-shifts. A range of models were generated and both the effect where the compaction was too confined to the wellbore and also the effect where it was too widely spread were captured in those models. The reservoir model with the highest MQF was between the extremes. This was used in combination with other data sources to select the new gas-oil relative permeability curves for the full field reservoir model.
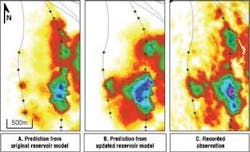
3. Flank improvement: The third study focuses on several of the wells on one flank of the field where mismatches between the location and direction of time-lapse effects due to production where obvious. By changing the skin of the well, local thickness variations, and the contribution of the various perforations along these horizontal wells, better matches between the observed responses and the predicted responses from the reservoir model were achieved. A wide range of MQFs was calculated for different wells and different time-lapse windows to compare the original model with the updated one. The final reservoir model improves the match between the observations and the modeled responses. These modifications were ported back to the full field model.
Acknowledgements
We thank BP and the Valhall partnership (BP Norge AS, Amerada Hess Norge, Total E&P Norge AS, and AS Norske Shell) for permission to publish this paper. We thank our colleagues who helped with this abstract: O.J. Askim, Katherine Hyland, Daniel Johnsen, Ra’ed Kawar, Roar Kjelstadli, Einar Kjos, Tron Kristiansen, Scott Lane, Terje Litlehamar, Ruth Synnøve Pettersen, Gunnar Tjetland, and Giles Watts.
Editor’s note: This paper was presented at EAGE.
References
Askim, O. J. [2003] Seismic forward modeling in a chalk reservoir with permanent monitoring, 65th EAGE Conference and Exhibition, Expanded Abstracts Barkved, O. I.,
Barkved, O. I., Kommedal, J. H., Kristiansen, T. G., Buer, K., Kjelstadli, R. M, Haller, N., Ackers, M., Sund, G. and Bakke, R. [2005] Integrating Continuous 4D Seismic Data Into Subsurface Workflows 67th EAGE Conference and Exhibition, Expanded Abstracts
Barkved, O. I., Bærheim, A. G., Howe, D. J. , Kommedal, J. H. and Nicol, G. [2003] Life of Field Seismic Implementation – “First at Valhall” 65th EAGE Conference and Exhibition, Expanded Abstracts
Hatchell, P. J., Kawar, R. S. and Saviski A. A. [2005] Integrating 4D seismic, Geomechanics, and reservoir simulation in the Valhall oil field, 67th EAGE Conference and Exhibition, Expanded Abstracts
Kjelstadli, R. M., Lane, H. S., Johnson, D. T., Barkved, O. I., Buer, K. and Kristiansen, T. G. [2005] Quantitative history match of 4D seismic response and production data in the Valhall field, Offshore Europe 2005, SPE 96317
Kommedal, J. H., Barkved, O. I. and Henneberg, K. [2005] Repeatability using a permanently installed seismic array, 65th EAGE Conference and Exhibition, Expanded Abstracts
Kristiansen; T. G., Barkved, O. I., Buer, K. and Bakke, R. [2005] Production Induced Deformations Outside the Reservoir and Their Impact on 4D Seismic, IPTC 10818
Lane, H. S., Kjelstadli, R. M., Barkved, O. I., Johnson, D. T., Askim, O. J. and van Gestel, J. [2006] Constraining Uncertainty with frequent 4D seismic data at Valhall field, Offshore Technology Conference, OTC18222
van Gestel, J., Barkved, O. I. and Kommedal, J. H. [2007] Valhall Life of Field Seismic Automated Workflow, 77th SEG Annual Meeting, Expanded Abstracts


