PV-10 model provides effective means of computing lifetime value of platform facilities

Twenty structures had values greater than $500 million in 2016
Mark J. Kaiser
Center for Energy Studies,
Louisiana State University
Mingming Liu
Academy of Chinese Energy Strategy
In part three of this series on deepwater Gulf of Mexico structures, production, revenue, and reserves, valuation estimates from 2016 are used to characterize the inventory.
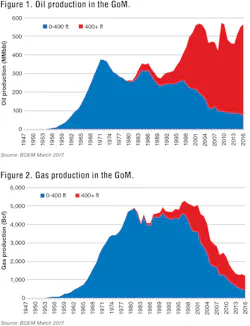
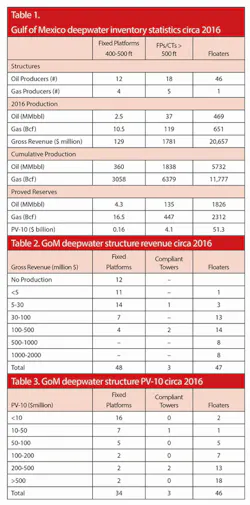
In 2016, structures in water depth greater than 400 ft produced 87% of the crude oil and about two-thirds of the natural gas production in the GoM.
Floating structures generated about $21 billion and their reserves are estimated to be worth about $51 billion circa 2016, compared to the $1.9 billion in revenue and reserves worth about $4.3 billion for deepwater fixed platforms and compliant towers. In 2016, 12 fixed platforms were not producing and 11 fixed platforms and one floater had gross revenue less than $5 million.
GoM production
Since 1947, the outer continental shelf GoM has produced about 20 billion barrels (Bbbl) of oil and 186 trillion cubic feet (tcf) of natural gas.
In 2016, the GoM produced about 565 million barrels (MMbbl) of oil and 1.21 tcf of natural gas, about 15% of domestic oil and 5% domestic gas production.
More than half of total crude oil (12.1 Bbbl) and about 80% of the Gulf’s natural gas (159 tcf) have been produced in water depths less than 400 ft and has been in steady decline since the mid-1980s.
In water depths greater than 400 ft, oil production continues to increase, marked by fluctuations due to hurricane activity and the Macondo oil spill, and the intermittent basis of bringing a small number of capital-intensive projects online.
Deepwater gas discoveries have not been as significant and most deepwater gas production is associated with oil. Consequently, overall gas production in the GoM has declined at a relatively steady pace.
The result is that GoM oil production is near its all-time peak and whether it will continue to increase depends upon whether new production can outpace declining fields.
GoM gas production has fallen steeply from historic levels and is expected to continue to decline. Today, the GoM is primarily a deepwater oil-producing province.
Structure production
In 2016, there were 36 producing fixed platforms, three compliant towers, and 47 floating structures in the deepwater GoM.
All the floaters except Independence Hub and the three compliant towers are classified as oil producers, while most of the fixed platforms are also oil producers (30 vs. nine gas producers).
Producing gas oil ratios (GORs) are used to classify wells as ‘primarily oil’ (oil) or ‘primarily gas’ (gas), and a similar classification is used to classify structures.
Cumulative gas oil ratio (CGOR) is defined as the cumulative gas production measured in cubic feet (cf) to total oil production measured in barrels (bbl), and a CGOR threshold of 10,000 cf/bbl is used to delineate oil producers (<10,000 cf/bbl) from gas producers (CGOR >10,000 cf/bbl).
Sixteen platforms in 400-500 ft water depth produced approximately 2.5 MMbbl of oil and 11 of bcf gas in 2016, while the 20 fixed platforms and three compliant towers in >500 ft water depth produced 37 MMbbl of oil and 119 bcf of gas.
The 47 structures in the floater class produced 469 MMbbl of oil and 651 bcf of gas.
To date, deepwater fixed platforms and compliant towers have produced about 2.2 Bbbl of oil and 9.5 tcf of gas, while floating structures have produced about 5.7 Bbbl of oil and 11.8 tcf of gas.
Gross revenue
Collectively, the 16 deepwater structures in 400-500 ft water depth generated about $129 million, or $8.1 million per structure in 2016, compared to $1.8 billion total, or $78 million per structure for structures in >500 ft water depth. Floaters generated about $21 billion total, or about $440 million per structure on average.
In 2016, 12 fixed platforms were not producing and 11 fixed platforms and one floater had gross revenue less than $5 million.
Gross revenue is a first-order estimate of actual revenues received computed using the average Light Louisiana Sweet crude ($40.6/bbl) and Henry Hub natural gas price ($2.52/Mcf) in 2016.
Condensate is valued at crude oil prices even though it is normally discounted and will generate less revenue on a volume basis. Also, since product impurities are not available, no adjustments for quality or location differentials were made. Net revenue received is gross revenue reduced by the royalty payment which for most structures is 16.67% of gross revenues.
Structures which generate less than a few million dollars annually may be considered marginal or approaching marginal status because the direct operating cost for deepwater structures – production and maintenance crew, helicopter flights, service boats, chemicals, maintenance expenses, etc. – are approximately of this magnitude.
Operating cost is not directly observable and economic limits across the sample are variable and depend upon structure type and age, number and type of well, location, maintenance requirements, ownership, terms of production-handling agreements, and other factors.
There were 18 structures which generated between $5-30 million and for many of the structures of this class, would be considered as approaching marginal status.
There were 20 structures which generated between $30-100 million and 20 structures which generated between $100-500 million. Eight structures, all floaters, generated between $500-1000 million, and another eight floaters each generated more than $1 billion.
Reserves
Reserves are estimated using producing well inventories circa 2016 and standard industry models and assumptions. If reserves are computed according to SEC/SPE definition, there is a 90% chance the estimates will increase from current estimates in the years ahead, and so the values are a lower bound conservative estimate.
Fixed platforms in 400-500 ft water depth are estimated to have proved reserves of 4.3 MMbbl of oil and 16.5 bcf of gas, compared to 135 MMbbl of oil and 447 bcf of gas for fixed platforms and compliant towers in >500 ft water depth, and 1.8 Bbbl of oil and 2.3 tcf of gas for floaters.
PV-10
Whereas gross revenue is a snapshot of the value of production under current operating and economic conditions, PV-10 provides an indication of the (discounted) value of future production arising from proved reserves.
PV-10 represents the present value of the expected cash flows generated from reserves discounted at 10% on a before-tax basis computed using a standard set of assumptions and procedures on decline rates, oil and gas price, operating cost, and inflation rate.
Like reserves, PV-10 requires a model to compute, and although it is not a GAAP measure it is still commonly used and reported.
PV-10 values for each producing structure was computed using a constant oil price of $60/bbl and gas price of $3/Mcf, 16.67% royalty rate, and $7/boe operating cost.
Sixteen structures had reserves values less than $10 million and seven structures had values between $10 and $50 million.
Twenty structures, mostly floaters, had PV-10 values greater than $500 million.
In total, the fixed platforms and compliant towers in water depth >500 ft had a PV-10 of about $4.1 billion, compared to the PV-10 of floaters estimated at $51.3 billion. The PV-10 value of fixed platforms in 400-500 ft water depth was about $160 million.