Brian Wm. Schulte, GeoPsi Consulting and HCC-NE Energy Institute
Dr. John Galiotos, HCC-NE Energy Institute
Lourdes Goodson, BP and HCC-NE Energy Institute
Efrain Melendez, Explora Seismic Processing
The success of the Gulf of Mexico deepwater offshore hydrocarbon exploration and production is due to technological advances in seismic acquisition, processing, interpretation (AVO and pore pressure), and the integration of seismic with petrophysics.
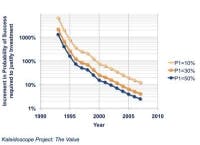
The goal of AVO and pore pressure is to reduce the risk associated with drilling deepwater hydrocarbon wells. AVO helps predict rock properties such as the matrix (lithology, thickness, porosity) and the fluids in the rock. Geopressures are used commonly to preplan and help prevent problems before and during drilling (geohazards):
- 1. Predict zones which may have high pore pressures
- 2. Estimate when to case in the borehole
- 3. Predict well cost for an approval for expenditure.
Geopressures are used not only for drilling, but also impact the prospect, play appraisal, and economics, and should be used to determine whether the well will be economically successful by looking for seal.
The deepwater in the GoM is divided into three types of plays (Cossey, 2004). One is the Flex Trend. The Flex Trend is just beyond the shelf edge where there is a flex in the seafloor profile. Most discoveries were small reserves, discontinuous sands. They were AVO “bright spots” on 2D data. Larger flex trend discoveries were Pompano, Cognac, Lena, and Zinc.
Next are the Fold Belts. As sediments are deposited on top of the salt, the salt, which has lower density than the sediments, begins to move upward, forming salt pillows, fold belts, and thrusts in the sediments above the salt. The centers of the folds or thrusts are salt, and hydrocarbons flow into reservoir sands that are at the top of the folds or truncated by the thrust faults.
Third are Mini Basin Plays. When the salt begins to form into pillows, a withdrawal basin forms. These are the mini-basins. There, turbidity currents (submarine fans) and source rocks are deposited.
When the salt moves upward, the formation of a canopy and a stock is observed. As the salt continues to flow, the dissolution of the stock and a canopy remains in place. The dissolution of the stock provides a path for oil in the lower Jurassic source rock to migrate upward under the canopy. Any one of the plays discussed above can occur under a salt canopy.
All three plays are related to the evolution of salt diapers from the early stages (fold bets) to the final stages (salt canopies). Salt tectonics, sedimentation, and growth faulting are intimately related. Deep sedimentary basins containing salt are more prospective than basins without salt because salt not only creates the necessary environment for trapping, but it also dissipates heat more efficiently. As a result, the deeper portions of the basin are cooler, causing the source rock to be in an oil window for a longer time.
Ostrander (1984) first demonstrated the potential of AVO as a hydrocarbon indicator. Rutherford and Williams (1989) further broke the AVO signatures into three classes based upon the acoustic impedance between the reservoir sand and the overlying shales:
Class 1 AVO sands are higher impedance sands than the encasing shales. These are generally Mesozoic and Paleozoic sands (Roden et al., 2005).
Class 2 AVO sands are equal in acoustic impedance as the surrounding shales. These moderated compacted sands (porosity 15% to 25%) are found both offshore and onshore. Gross interval velocities of the sands are typically between 8,500 and 12,500 ft/s (2,650–3,650 m/s) (Roden et al., 2005). Sometimes the top of the sand is not as well defined as the base, thus the base of the sand is employed to find Class 2 AVOs.
Class 3 (bright spots) are the classical bright spots where the gas sands have impedance lower than the encasing shales. These reservoirs commonly have porosities >25% and contain gas or high gas-to-oil ratio oils. The gross interval velocity of these sands is usually <8,500 ft/s (2,650 m/s) (Roden et al., 2005).
To do AVO well modeling quickly and efficiently, a generalized linear formula of the Zoeppritz equation is used. The linear approximation theoretically fits amplitude changes to offsets. It does this by utilizing the Acoustic Impedance (Rp, NI, and Intercept), which is constant as the first term in all the equations, and a second term. This second term is a particular AVO attribute, such as shear wave reflectivity, Poisson reflectivity, or gradient. The only difference among the methods is the assumptions made to simplify the Zoeppritz equations; which affects the complexity and accuracy of the approximation used (Burianyk, 2000).
Hilterman’s (1989) equationHilterman’s equation is one of the better ones to model the seismic AVO response using Vp, Vs, and r from well data or petrophysical equations.
By modeling the well data using the rock calculator, the type of AVO can be analyzed, and this information can be utilized in the interpretation of the seismic data.
AVO can be used in areas above the salt, such as the fold belts or in the Mini Basins. It is difficult to use AVO below the salt cavity because the salt acts as a lens, creating problems with the incidence angles.
AVO anomalies are due to a decrease in density and velocity within the rock. In AVO theory, it is assumed to be a result of porosity changes and fluid changes. If there is a high pore pressure zone, there also is a decrease in velocity and density, similar to an increase in porosity and fluid changes. This is why it is common to have an AVO anomaly where we have the top of high pore pressures. To identify whether the AVO anomaly is a hydrocarbon filled sand or the top of geopressures, it is necessary to understand pore pressures.
HCC-NE EI uses Traugott’s approach to teach pore pressures. This uses Eaton’s Equation (1972). This approach emphasizes a general understanding of pore pressures.
PPZ = OBZ - (OBZ - PnZ)*(ΔTn/ΔTo)X
Eaton’s Equation:
Where:
PPZ - Pore pressure at depth (z)
OBZ - Overburden at depth (z)
PnZ- Hydrostatic or normal pressure at depth (z)
ΔTn - Normally compacted sonic Interval Transit Time (ITT), interval velocity, resistivity at depth (z)
ΔTo - Observed sonic Interval Transit Time (ITT), interval velocity, resistivity at depth (z)
X - Transformation exponent based on age and basin location (generally it is 3 and some set it to 5 below the top of the geopressure). Use 1.2 if using resistivity information (Traugott, 1997).
One important aspect of using a normal compaction trend method such as Eaton’s Equation is to determine the normal compaction trend for shales. When changes are made in the pressure domain, a change in the linear trend within the interval velocities from the normal compaction trend is anticipated, and these different trend lines are referred to as compaction lines.
Using compaction lines to quantitatively calculate changes in the geopressures allows a more accurate prediction of where casing should be placed.
Traugott is used to calculate the overburden, pressure gradient, and fracture gradient.
The Overburden Gradient is related to the height of the water column and the sediment column using the equation:
O =[(8.5)(W) + (ravg)(D-W-A)]/D
Where:
W is the depth of the water
D is the depth from the kelly bushing
A is the size of the air gap from the derrick floor to the top of the sea
r avg is the average density of the sediment in ppg, which can be calculated from:
ravg = 16.3 + {(D-W-A)/3125}0.6
The fracture gradient is the pressure it takes to fracture the formation and to cause loss returns into the induced fracture. A value for FPG is measured directly with a leak-off test (LOT).
If a LOT is not available, the following equation can be applied:
F = (k)(O-P) + P
A value of 0.33 is used for k in hard rocks (like low porosity carbonates), and a value of 0.5 to 1 for soft shales, with a good average value being 0.64. O is the Overburden Gradient, and P is the Pore pressure Gradient. As the pore pressures approach the fracture gradient, the seal is lost, if drilling an AVO anomaly, that anomaly may be fizz gas, which is low saturated gas.
Acknowledgments
We thank the Petroleum Engineering Technology Students Association (PETSA) and the staff at HCC-NE EI. We also thank Larry Wood and Eileen Murphy of Explora Seismic Processing, who helped edit this paper. We give special thanks to companies such as GeoPsi Consulting, Explora Seismic Processing (ESP), Texseis, Shell, BP, and the Geophysical Society of Houston (GSH), which have helped with the HCC-NE EI Petroleum Engineering Technology program.
Bibliography
Burianyk, M., 2000, Amplitude-vs.-Offset and Seismic Rock Property Analysis: A Primer, CSEG Recorder November 2000.
Cossey, S.P.J., 2004, Deep GOM Discoveries Toasted Over 30 Years Celebrations Began With Cognac, AAPG Explorer.
Eaton, B.A., 1972, Graphical method predicts geopressure worldwide, World Oil, V182, p51-56.
Hilterman, F.J., 1989, Is AVO the seismic signature of lithology? A case history of Ship Shoal-South Addition, The Leading Edge 9
Ostrander, W.J., 1984, Plane-wave Reflection Coefficients for Gas Sands at Non-normal Angles of Incidence: Geophysics, 49, 1637-1648.
Roden, R., Forrest, M., and Holeywell, R., 2005, The Impact of Seismic Amplitudes on Prospect Risk Analysis, Business Briefing: Exploration & Production; The Oil & Gas Review issue 2.
Rutherford, S.R., and Williams, R.H., 1989, Amplitude versus offset variations in gas sands, Geophysics, Vol. 54, P 680-688.
Shaker, S.S., 2007, Calibration of Geopressure Predictions using the Normal Compaction Trend: Perception and Pitfall, CSEG Recorder
Suaudeau, E., Le meur, D., and Hermann, P., 2002, Optimum stacking from optimal velocities, 2002 CSEG Abstracts
Traugott, M., 1997, Pore pressure and Fracture Pressure Determinations in Deepwater, Deepwater Technology Supplement to World Oil
Whaley, J., 2006, Huge Potential Still Waiting in the Gulf of Mexico, Geo ExPro


