New DTS interpretation improves matrix acidizing offshore Mexico
Lizeth A. Inda Herrera
Emmanuel O. Soto Lopez
Marco Antonio Castillo
PEMEX
Pierre Ramondenc
Andrea L. Murillo Vallejo
Israel Rosado Rivero
Miguel G. Romandia
Schlumberger
Enhancing production in carbonate formations using the principle of matrix acidizing seems deceivingly simple. Typically, acid is injected into the formation at pressures below the fracturing pressure to dissolve the carbonate minerals (calcite and dolomite) and bypass the near-wellbore damage by creating dissolution channels called "wormholes." The intended result is improved permeability in the matrix nearest the wellbore. Despite the seemingly simple process, matrix stimulation treatments often fall short of expectations because of limited knowledge of the rock morphology and petrophysics.
Without proper knowledge of parameters including the inherent double porosity and high permeability contrasts of carbonate rocks, the variable extent of damage, the presence of natural fractures, and the existence of differential pressure between reservoir layers, the acidizing treatment design is far from optimized. Controlling the placement of stimulation fluids remains one of the main challenges during matrix acidizing treatments in carbonate reservoirs.
This was a particular challenge for PEMEX in its efforts to revitalize production in its main offshore Gulf of Mexico fields, which experienced a rapidly declining production curve year-on-year. Historically, the stimulation process consisted of pumping large volumes of acid-based treatment into the formation, but with little control on zonal coverage.
Optimum fluid placement typically relies on two distinct steps: 1. Figuring out where along the wellbore acid and diverter fluids need to be injected to ensure that the reservoir will produce to its maximum capacity; and 2. Physically placing those fluids into the proper intervals. PEMEX used conventional coiled tubing (CT) to address fluid placement, using jetting tools to remove damage at the tubular and perforation holes and energize the treatment in the desired area. To evaluate where and how much fluid was injected into each zone, the operator initially used radioactive tracers. However, this method was not sufficiently accurate, and the radioactive tracers posed safety risks as hazardous materials.
Help from fiber optics
The Schlumberger ACTive family of live downhole CT services was selected for real-time treatment monitoring of subsequent matrix acidizing jobs. The ACTive CT services convey live downhole measurements on fiber-optics, telemetry-enabled CT, and consist of a bottomhole assembly (BHA), surface electronics and interpretation software. Downhole data, including internal and external pressures, temperature, casing collar locator, gamma ray and distributed temperature sensing (DTS), can be used for various intervention operations independently. However, PEMEX was most interested in how these measurements can be used collectively to optimize acidizing.
The efficiency of CT matrix stimulation can be improved through live monitoring of injection rates and downhole pressure and temperature to ensure that maximum fluid penetration and diversion are achieved, leading to optimized treatment volumes. The real-time process improves treatment performance and enhances the design of subsequent CT matrix stimulation.
An additional service known as DTS inversion improves the speed and the confidence with which the operator responds to the temperature readings recorded downhole to make actionable changes to the stimulation program. Conventional DTS enables the equipment to record temperature readings at several predetermined depths over time, creating a survey that qualitatively identifies fluid movement into the treated pay zones based on the formation's cool-down/heat-up effects. This technique had some limitations, however, as the data recorded needed to be converted, interpreted, and then translated into oilfield usable graphics and data tables. The time required to get a final result from the readings was often so long that the window to modify the current treatment to improve the well response was, on most occasions, already closed.
Moving interpretation to real time
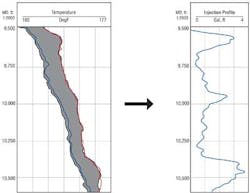
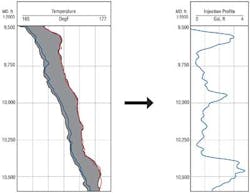
DTS inversion shifts interpretation from qualitative to quantitative through a module containing an inversion algorithm coupled with fluid placement and thermal models.
This has several advantages. It is a step toward quantification of treatment effectiveness, since the tool output is a fluid coverage profile. Engineers can identify the injection ratios of the treatment flow within the interval(s) of interest. It can be used to carry out a sensitivity analysis on design parameters that were known with little certainty, and thus gain a better understanding of the temperature evolution post-stimulation. In addition, the inversion algorithm is fast enough – typically taking only minutes to run. It speeds and refines the evaluation of treatment effectiveness and provides new opportunities for fast corrective actions if required (e.g., need for diversion or re-stimulation of a particular zone), and a real-time optimization of the ongoing job.
An effective DTS interpretation using the inversion method in PEMEX's carbonate acidizing jobs followed this procedure:
1. Run-in-hole (RIH) to the desired depth (i.e., below all the pay zones to be evaluated), keep the CT stationary, and shut in the well. An accurate depth correlation must have been done to make sure that the recorded measured depth (MD) is accurate.
2. Without moving the CT, start acquiring the DTS survey. Monitor wellbore temperature evolution and confirm temperature stabilization before stopping the survey. This first DTS survey will be used to define the baseline geothermal profile and is crucial for the later inversion process, as it measures the initial conditions.
3. With the well still shut in, perform the first stage of the matrix stimulation treatment. The CT string can move during the treatment. Should bullheading be used, the CT is kept stationary and DTS data are recorded while the first treatment stage is pumped down the annulus of the CT and the well tubing. This DTS acquisition can help make sure that the bullheaded fluids can reach the bottom of the interval.
4. As soon as pumping stops and all the treatment fluid is injected, shut the well in and start the DTS acquisition to monitor the post-treatment temperature evolution in the wellbore. If the CT was moved during the previous stage, it must be placed back to the same depth as the first survey before starting the acquisition. Initiate a new DTS survey to monitor the post-treatment temperature evolution in the wellbore. This acquisition should take at least three hours to give sufficient time for the thermal exchanges and exothermic reaction heat to develop at the reservoir level. This survey will be used in the inversion process to evaluate the formation admittance of the treatment fluids.
5. Process and analyze the temperature data using the DTS inversion and derive the fluid invasion profile.
6. Depending on the results, the operator may redesign the treatment, pump extra stages, apply diversion to the zones that were identified as thief zones, or kick off the well to flow back the stimulation products.
7. If the operator decides to pump extra stages, the subsequent treatments shall maintain the shut-in condition and steps three to six shall be repeated until the outcome is deemed satisfactory.
Offshore testing
PEMEX used this treatment workflow in several offshore wells. The following case study represents the potential that this new stimulation approach holds to fully unlock the potential of those offshore fields.
The well was a nearly vertical cased-hole perforated oil producer, with a maximum deviation of around 9°. Total depth is approximately 19,290 ft (5,880 m) MD, presenting a slight deviation starting at 16,634 ft (5,070 m) MD. The producing zone is completed with 5 ½-in. casing and features three perforated intervals: the top one is between 18,497 and 18,550 ft (5,638 and 5,657 m) MD, the middle one between 18,661 and 18,783 ft (5,688 and 5,725 m) MD, and the bottom one between 19,032 and 19,183 ft (5,811 and 5,847 m) MD.
The formation is a mix of limestone, dolomite, and clay. The downhole flowing temperature is around 177°C (350°F), with a reservoir pressure estimated at 4,350 psi (30 MPa). Prior to the intervention, the well could flow oil with a choke at ¼ in. When opening the choke to 11⁄8 in., water was produced with a water cut up to 80%.
The objective of the intervention was to stimulate the three perforated intervals to improve oil production and reduce water production. DTS monitoring was implemented to evaluate the efficiency of the treatment and to gain additional information on the behavior of the three perforated intervals.
The intervention workflow began by running pressure, temperature, and gamma-ray memory gauges to maximum depth (the high temperature of the bottom of the well prevented the use of downhole real-time gauges). The values from this first run were later used to quality-check the DTS data obtained in the subsequent run. The ACTive BHA was then placed at 19,127 ft (5,830 m) MD and a first DTS survey was acquired for three hours to establish the geothermal baseline.
While keeping the CT stationary at that depth and with the DTS acquisition running, a preflush of diesel (40 cu m/≈250 bbl) was bullheaded down the annulus of the CT and well tubing at a rate of 3 bbl/min. The subsequent warm-back was also acquired for three hours. Based on the interpretation of the DTS data and the identification of thief and tight zones, it was decided to pump 33 cu m (≈207 bbl) of solvent, immediately followed by 10 cu m (≈63 bbl) of acetic acid through the coiled tubing in front of the bottom interval. A new DTS survey was obtained to determine whether the fluid was admitted into that perforated section.
Finally, 190 cu m (1,195 bbl) of a mixture of acetic acid, solvent, and diverter was bullheaded down the tubing and CT annulus. DTS data were acquired during both that pumping stage and the subsequent three hours of warm-back with the well shut in. Once the stimulation treatment was over, nitrogen was pumped through the CT to lift the well and put it back into production.
The main acid stage consisted of bullheading a mix of acid, solvent, and diverter. Building on the experience of the preflush stage, it was decided to gradually increase the surface injection rate in an effort to push the treatment fluid further down the wellbore, past the base of the middle perforated interval.
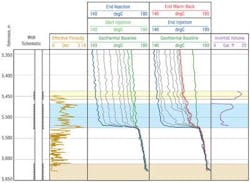
As can be seen from the temperature evolution recorded during the bullheading sequence (fourth track from left), despite an increase from 3 to 4 bbl/min, and then to 6.5 bbl/min, treatment fluid never travelled past the middle interval to reach the bottom interval. Looking at the warm-back during the shut-in period, it is clear that no exothermic reaction occurs at the lower interval of the well.
The temperatures in front of the top and middle intervals never go beyond the geothermal values; however, this does not mean that no exothermic reaction occurs, since the creation of heat by the reaction competes with the cooling effect of the injection itself (the treatment fluid penetrates the formation at a much lower temperature than that of the formation itself).
The use of the inversion algorithm in that zone helps accurately evaluate those two effects and provides a quantification of the intake across the entire interval. As noticed after the preflush injection, a portion of the middle perforated interval allowed less fluid injection than the rest (also suggested by a faster warm-back). Yet, the injection ratio changed from 38% during the initial preflush compared to 51% during the main acid treatment. This means that the top interval benefitted from the treatment and a more balanced connectivity should be expected following the intervention.
Conclusions
This case history is characteristic offshore Mexico in many wells where the treatment fluid cannot reach a specific interval, either because the formation is altered due to the presence of fissures, fractures or a significantly higher permeability/porosity, or because the treatment program is not fully adapted to the wellbore conditions. The use of ACTive service with DTS profiling to provide a temperature profile of the entire wellbore to monitor fluid placement and well production performance helps bridge this gap.
For instance, had the treatment been pumped as initially planned by simply bullheading all the fluid, the extent of the imbalance between the three perforated intervals downhole would not have been discovered. Furthermore, the team would not have diagnosed that the bottom interval could not be reached by bullheading the fluid, no matter the rate, or that the formation was so tight and that the properties of the middle interval caused all fluid spotted directly with the CT at the lower interval to flow back to it.
Finally, the application of the DTS quantitative method using the inversion algorithm was successful in helping to bring understanding to a level not possible by a simple qualitative interpretation of the temperature traces – how the top and middle intervals both reacted to the treatment, for example.
Although the bottom interval could not be stimulated, valuable information was collected regarding the reservoir dynamics in this field. The analysis helped identify how future interventions might be modified to stimulate bottom, tight zones. While CT conveyance and bullheading techniques together were insufficient in this case, mechanical diversion using inflatable packers may be a better alternative for upcoming interventions.
Ultimately, the joint use of ACTive real-time downhole measurements and distributed temperature surveys were key in tracking the exact placement of treatment fluids to allow comparison of the actual performance versus the design prepared for that intervention. In particular, the technique clearly identified deviations from the expected formation behavior during the design phase, and thus provided valuable information on actions to take during the intervention.


