Ice data management system improves Arctic operations
Terry Kennedy
ION Geophysical
More than 100 years ago when the Titanic struck an iceberg and sank in the North Atlantic Ocean, the only ice detection technologies available to the captain and crew were visual sightings and wireless transmissions in Morse Code from other vessels. Over time, additional ice detection technologies have emerged to protect cruise vessels and other commercial operations from the threat of sea ice and icebergs. These include aerial photography, marine radar, satellite imaging, infra-red cameras, weather bulletins, and sea ice charts from government agencies and service providers.
With so much ice data available, the risk of a collision today would seem remote. Nevertheless, in recent decades, collisions with icebergs have occurred at a rate of more than two per year. Why? More tourists are visiting Antarctica each year; a growing number of commercial vessels take the Northern Sea Route across the Russian Arctic to reduce time and fuel costs; and because the US Geological Survey estimates that one-quarter of the planet's undiscovered but technically recoverable hydrocarbons lie above the Arctic Circle. With the intensification of maritime activity in ice-prone waters, the risk increases.
Even with many sources of ice data, a single piece of missing or overlooked information can lead to a collision. In 2007, the MS Explorer, an ice-reinforced cruise ship, sank in the Antarctic Ocean due to a misjudgment. The captain and crew were experienced ice navigators, but they underestimated the thickness and density of sea ice they began to plow through one night. They mistakenly believed that they were entering a thin first-year sea ice field and maintained full speed. The vessel then struck a 15-ft (4.6-m) "wall" of older, harder glacial ice that exceeded the Explorer's ice classification, slicing open the hull. The ship sank days later. All passengers and crew were rescued safely.
One reason ship captains and professional ice observers can still misjudge ice conditions is that, even today, most of them still depend largely on a disparate mix of manual methods to make sense of diverse ice information. This is, however, no longer the only option.
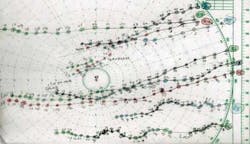
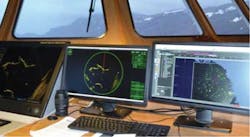
In 2011 and 2012, an E&P operator conducted site surveying, scientific coring, and high-resolution seismic streamer operations near the coast of Greenland. In this area, the frequent presence of both large and small icebergs needs to be carefully managed in order to keep personnel and equipment safe. To assess the risks from hour to hour, dedicated ice observers tracked bergs around the clock using marine radars and satellite images, calculated their mass using spreadsheets, and posted their speed, direction, and position on paper polar plots. Critical ice information was scattered around the bridge. Obtaining up-to-date data required ice specialists to print hardcopy plots and images elsewhere on the ship. Keeping the captain well informed, especially under extreme conditions, was both challenging and time-consuming.
The operator's ice management plan prescribed a threshold perimeter around the survey vessel, based on the time required to safely suspend operations and move out of harm's way. However, for mobile seismic operations, there was no way to plot the constantly moving perimeter on paper along with iceberg positions. Working closely with the captain, ice observers had to estimate where an encounter might occur and exactly when to move off site/line. To guarantee the safety of the vessel, crew, equipment, and environment, they frequently decided to move off location sooner and wait longer to return than was absolutely necessary. This resulted in nonproductive downtime.
Prior to the 2013 operating season, the operator learned about recent advancements in ice data visualization and decided to optimize and field test Narwhal, a new, integrated ice management system developed by ION's Concept Systems. Narwhal evolved from the company's 30-plus years of experience in data management and software development, as well as knowledge and experience gained during eight seasons acquiring seismic data in Arctic waters.
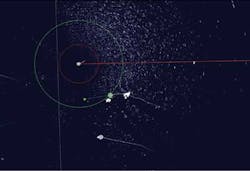
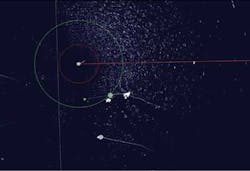
Relevant ice information was automatically updated via ION's remote data-hosting service and combined, in multiple GIS layers including marine radar, on a single screen. Geo-referenced map and satellite data were blended with temporal dimensions in an animated "calendar" or time-slider. Using existing ice data, Narwhal predicted iceberg positions over ensuing 24-hour periods and automatically displayed current iceberg locations, forecasted trajectories, and the limits of the ship's safe perimeter on a single screen, even during mobile operations.
Because the captain and crew could view data in one place, they could quickly assess risks. It was estimated in 2013 and 2014 that designated ice observers gained roughly 30% more time per shift to make visual observations and to discuss options and risks with the bridge officers. Communications were deemed more effective and decisions were made faster, and with greater confidence. With better ice intelligence, the vessel could remain safely on site longer and could resume operations faster following an ice incursion into the safety perimeter. This was demonstrated in September 2014, when ice downtime was reduced by a factor of three compared to September 2012 at the same location under similar operational and ice conditions.
Advanced ice data management and visualization technology can also protect stationary or fixed offshore drilling and production facilities. For example, many oil fields are located along the infamous "Iceberg Alley" off the Grand Banks of Newfoundland (where the Titanic went down.) Every minute the bit stops turning or oil stops flowing, asset owners lose money. Normally ice management vessels (IMVs) keep icebergs from penetrating the safety perimeter. At times, however, IMVs may not be able to defend all the FPSOs and drilling rigs. During the heaviest ice seasons like 2014, hundreds of bergs can threaten operations. Recently, a rig had to be towed off site for a week and another for two weeks until the ice threat passed, an expensive course of action. Rig day rates and associated costs offshore Newfoundland are roughly $1 million. Offshore Greenland, they may be twice as high.
So how can Narwhal's new ice management technology help? By integrating more data in one place, automating tasks, and tracking more icebergs in a timely manner, operators can pinpoint the arrival and departure of dangerous ice incursions more accurately than before. Narwhal enables these savings automatically and does so while also increasing the safety of personnel, equipment, and the environment.
Another new valuable tool is Narwhal's "trafficability" or routing capability. Every vessel has a specific ice class classification, indicating the maximum concentration of sea ice it can safely navigate. Combining vessel classes with satellite images and color-coded ice charts (updated daily) ice analysts can graphically identify "go" and "no-go" zones. They can quickly determine appropriate routes for tankers and supply boats to traverse icy waters between producing fields and the mainland, ensuring safety and minimizing fuel costs. In the past, even with radar, satellite images and ice charts, it was very time consuming for ice observers to integrate or update reams of ice, weather, and ocean information. Using Narwhal's fully-integrated ice management tools, every piece of information is loaded automatically, time-stamped, and geo-referenced in a single database. As a result, ice observers, captains, and management can make more informed decisions, reduce downtime and costs under extreme conditions, and maximize the effectiveness of every operating season in icy waters.


