Digital model helps define long-term riser performance
Rasmus Engebretsen and Jan Muren, 4Subsea
Luke Johan Hondebrink and Besmir Kajolli, AkerBP
Using a combination of autonomous and online motion response sensors directly installed on the riser and interfacing FPSO structures, a fatigue counter prediction methodology can accurately measure environmental, FPSO and riser response data. Through the application of machine learning, this can build fatigue prediction models and ultimately significantly reduce uncertainties, enable live riser fatigue predictions, and provide a basis for life extension and improved accuracy of riser and vessel response analysis.
4Subsea recently applied the methodology on AkerBP’s Skarv flexible production riser located in the northern Norwegian Sea. The field boasts one of the world’s largest gas processing plants offshore.
The objective was to utilize actual weather and pipe process data to calculate realistic fatigue damage and estimate remaining service life. This was based on available onboard sensors, including a six-degree of freedom vessel motion response unit (MRU), temperature and pressure transmitters, and a weather forecasting model.
Leveraging online sensors
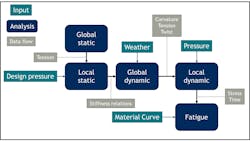
Traditional fatigue analysis consists of a global analysis of vessel and riser configuration; a local analysis of the multilayer flexible riser; a cycle count of stress ranges and a material curve to obtain fatigue damage.
By leveraging online sensors as part of a modern digital infrastructure, the accumulated fatigue damage can be monitored in real-time and operational decisions can be made based on intuitive and dynamic dashboards. In addition, the operator may benefit from favorable operational and environmental conditions, enabling increased production in cases where this is limited by riser pressure constraints. A secondary goal of this service is to:
- Remove weekly paper/pdf reporting
- Automate alarm events
- Simplify integrity evaluation
- Reduce review time by end user.
Data communication
The fatigue counter methodology developed by 4Subsea is an example of a modern digital service whereby the domain engineer can use the digital infrastructure to ingest data, build context and deliver operational insight back to operations. The processing and computation modules contain a pre-processing module, global response module, local response module and a fatigue module, in addition to import and output modules for data transfer between the data lakes. All live data is ingested from the company’s data lake service; Cognite Data Fusion (CDF). Authorization and secure access to AkerBP data sources on CDF are managed by the Cognite REST API.
To identify irregularities in the input timeseries, such as outliers or periods without data, the data ingested from CDF is initially processed in the 4insight data storage and processing service, which resides on Microsoft Azure. As a multi-tenant solution, the service is designed to help operators improve data quality and manage the ownership, security, sharing and use of data; while at the same time reduce operational cost and risk. Appropriate failsafe routines can be automatically applied, and the operator is notified when anomalies in the input time series occur.
The output time series from the Fatigue Counter is used to build and maintain dynamic dashboard reports visualizing the results. All data is written back to CDF using protocols specified by the Cognite APIs. The underlying algorithms in the Fatigue Counter are developed in the 4insight Python programming interface.
Vessel motion data
The FPSO motion response input is based on data received from a motion response unit (MRU) installed near the bow of the FPSO. The raw signal is processed by a band-pass filter to remove noise and higher-order effects, in addition to aggregation of standard deviation values. Notably, the MRU onboard Skarv did not report heave loads, and these loads are indirectly calculated using a state-of-the-art OrcaFlex model.
A vital part of the fatigue calculator is to estimate the FPSO response in periods when the MRU signal is lost or has errors. In this case, a failsafe routine and a model is used to fill the gaps of data. This model aims at estimating the average response, as this is most relevant for fatigue rather than extremes. With more than eight years of availability weather and motion data, several data points were used to establish this relation, yielding a relatively robust estimate of the mean values. The model performed well for the major part of the measured response but underestimated response extremes.
Riser curvature
The dynamic riser curvature along the bending stiffener is mainly determined by the FPSO inclination angle, applied forces on the riser from current and waves, and the riser tension. The dominant load component for riser curvature is the FPSO inclination angle, whereby the associated riser tension determines the shape of the curvature distribution along the bending stiffener. As there were no direct measurements of riser curvature on Skarv, it was estimated using available input, such as wave, wind, FPSO heading and FPSO motions, via a state-of-the-art OrcaFlex model.
An extensive load case matrix was run to cover all possible conditions before an algorithm was developed to account for riser environmental loading, FPSO heave and other relevant effects.
Local response
For a given pressure, the local response module is used to map the global response or curvature variation to fatigue damage at the hotspot of the flexible riser. This is achieved by interpolation between regression models established for a range of pressures based on simulations. This methodology is based on a large number of simulations using traditional rain flow counting and SN-curve to compute the fatigue damage. The underlying assumption is based on observations from the simulations showing that the cuvature variation governs the fatigue damage in this case.
Fatigue calculation response
The fatigue calculation module utilizes the historical data on damage, vessel motion and pressure to compute the accumulated damage and predict remaining lifetime for different forecast scenarios. For the Skarv evaluation this also included a forecast based on the actual pressure from the previous year.
Output data
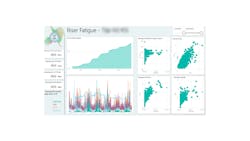
The output data is ingested to allocated space in CFD with version control and thereby linked to a live dashboard to extract insight to support operational decision and integrity management teams. The dashboard is customized and set up in cooperation between the operator and the third-party fatigue service. The list of tabulated outputs includes:
- Fatigue damage
- Accumulated damage
- Remaining fatigue service life
- Pressure status
- Motion status
- Weather status.
The output time series are contextualized to the operator, using Microsoft Power BI to highlight the most relevant results to the end-users.
Conclusion
Fatigue assessment of flexible risers as performed during the design phase may often be conservative when compared to real field experiences. The key point is to reduce uncertainties and assumptions, leading to a more reliable and updated estimate of remaining life. Domain engineers can leverage modern digital infrastructures to deliver powerful and robust calculation models with higher accuracy than traditional approaches.
The AkerBP Fatigue Counter project clearly demonstrates that the design service life could be extended by a factor of two when data from offshore measurements are utilized. Based on more than eight years of available weather and motion data, the Skarv Fatigue Counter algorithms are supported by traditional state-of-the-art global and local modelling.
On this basis, a service delivering ‘live’ fatigue estimates was developed and presented in a customized online dashboard to ensure all relevant stakeholders can make decisions based on the latest and most accurate insight and information.
Conservative assumptions are necessary to describe the average metocean criteria, operational data and vessel response over the flexible pipe’s lifetime. However, a digital model representing the real-life responses of the FPSO in various swell and wind-driven sea states can define, with high accuracy, the long-term characteristics of the riser system.

