North Sea outlook: Activity gap between Norway and UK set to grow
By Mathias Schioldborg, Rystad Energy
While Norway and the UK share a continental border, the two countries have seen their oil and gas industries take divergent paths during the last decade. E&P companies working along the Norwegian Continental Shelf (NCS) have seen a booming sanctioning market, and a strong investment level; and they have managed to uphold their oil and gas production. Meanwhile, the UK’s industry has taken a more muted path with falling activity and production. The goal here is to examine the two producers in terms of remaining resource potential, project sanctioning, investment paths, and production potential.
Figure 1 shows the estimated remaining recoverable resources for Norway and the UK Continental Shelf (UKCS) split by resource lifecycle and hydrocarbon type, in Rystad Energy’s base case. Norway has a strong upper hand by holding a total of 28.5 billion barrels of oil equivalent (boe) in recoverable volumes, against the 12.9 billion boe estimated in UK waters. The two countries have a relatively equal distribution between oil and gas volumes, although Norway has a slightly higher share of gas in its portfolio.
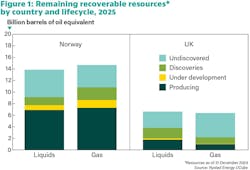
Besides holding more than twice the volumes, Norway also has a significantly larger share of its remaining resources in fields that have already started production – measuring 50% against the UK’s 21%. This gives Norway an edge as these volumes are much more likely to be extracted in the near-to medium term, also lifting the economic value of the resources. A similar pattern can be found for schemes that are currently being developed, as 8% of Norway’s resources belong in this category, against only 3% in the UK.
Over half of the UK’s estimated remaining resources are yet to be discovered (54%), led by 4.2 billion boe in undiscovered gas volumes – comprising 66% of its remaining gas reserves. This indicates that new exploration activity will be necessary for the country to realize most of its remaining potential, which again may prove challenging given the maturity of the region and low interest seen in the last few years. With this, the NCS remains significantly better slated to unlock new volumes in the next decade.
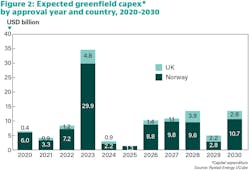
Figure 1 shows committed development capital expenditure – or greenfield capex – by the year that offshore projects are approved by Norway’s and UK’s government, between 2020 and 2030. Although both countries have seen investment incentives implemented during the COVID-19 pandemic, Norway’s sanctioning market has been significantly stronger than its neighbor in the last few years, measuring projects costing a whopping $48.6 billion sanctioned on the NCS between 2020 and last year, against only $8.1 billion on the UKCS.
Since 2020, Norway’s approved portfolio comprises several large schemes like Aker BP’s Yggdrasil hub and Valhall PWP-Fenris development; Vaar Energi’s Balder Future project; and a vast portfolio of subsea tiebacks such as the Skarv Satellites project. This large chunk of projects saw the NCS experience an all-time sanctioning high at $29 billion in 2023. The UK, however, has only seen sizable investments committed to the Rosebank production, storage and offloading (FPSO) vessel, which was approved in 2023, while the remaining portfolio consists of small-scale tiebacks.
Although both countries are now experiencing a dip in project sanctioning, Rystad Energy’s base case foresees that Norway’s values will swing upwards again in the next few years, while the UK is set to remain at a more muted level, at least in the very near term. In Norway, projects such as Equinor’s Ringvei West, Peon, and Linnorm are expected to spark approved investments of almost $10 billion annually on the NCS for most years until 2030, while the only sizable project in the UK is the Clair South scheme, set for sanctioning in 2029. Between this year and 2030, Norway is set to attract a total of $43 billion in approved development investments, while the UK is set to check in at $11.3 billion. This, again, highlights the diverging paths that the two oil and gas-producing countries find themselves on.
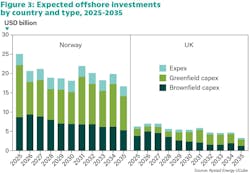
Following the sanctioning outlook elaborated above, Figure 2 shows expected annual offshore investments for the two countries, split into greenfield and brownfield capex, as well as exploration expenditure (expex), between this year and 2035.
Norway is now navigating through a strong spending cycle, and between now and 2035, the NCS is expected to attract an average offshore outlay of $19.9 billion per year, while the UKCS is projected to check in at a muted $5.4 billion per annum – measuring just over a quarter of Norway’s level. The decline rate is also markedly steeper in the UK, with total investments expected to drop 48% from $6.2 billion this year to $3.25 billion in 2035, against Norway’s 33%-drop from $25 billion this year to $16.6 billion in 2035.
The most prominent difference lies in the two countries’ greenfield outlooks. For Norway, the sanctioning wave of 2023 will see development spending comprise almost half of offshore investments for the next few years, and after 2030, a new greenfield upswing is expected in the region. This builds on an assumption of a strong exploration market now, and that companies will wish to accelerate the buildout of new discoveries before oil and gas prices decline in the longer-term, hence creating a wave of new projects into the 2030s. The UK, driven by a lack of commercial discoveries in recent years and frequent fiscal changes, is expected to see greenfield spending comprise 36% of its total investments until 2035.
The UK will see most of its attracted investments allocated to its already producing fields, as slightly over half of its offshore investments is foreseen as brownfield capex until 2035 (Figure 3). The region’s high prevalence of late-life fields generally makes it harder to drain the remaining reservoirs, which again pushes up the required spending per barrel to be produced. Most capital will as a result go into maintaining production, rather than scaling up new ventures.
Considering the differences in resource potential, sanctioning and investments, Figure 4 shows Rystad Energy’s base case production outlook for the two countries until 2035, split by hydrocarbon type.
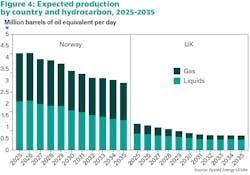
Norway currently produces over 4 million boe per day (boe/d), but a moderate decline is expected within the next 10 years – driven by large hubs such as Troll and Johan Sverdrup likely entering their decline phases, and new discoveries likely being unable to fully offset this stagnation. The country’s output is therefore expected to reach 3.4 million boe/d in 2030 and 2.9 million boe/d in 2035. The UK, which is currently producing around 1.13 million boe/d, is foreseen to reach 733,000 boe/d in 2035 and 625,000 boe/d in 2035, marking a steeper decline rate than for Norway.
In particular, the gas supply abilities of each country are set to take diverging paths during the next decade. Rystad Energy’s base case sees UK’s gas production more than halving from 435,000 boe/d of today to around 180,000 boe/d in 2035, while Norway’s gas production only will fall 23% in the period – from 2.1 million boe/d today to 1.61 million boe/d in 2035. With reduced supply from the UK – both domestically and to other countries – Norwegian gas exports will likely grow even more important in the medium term, particularly as Europe now strives to bolster its long-term energy security.
About the Author

Mathias Schioldborg
Mathias Schioldborg works as an oil and gas analyst at Rystad Energy, where he primarily covers offshore activity in Norway and the UK. He mainly focuses on production data, economic analysis, and company coverage. Before joining Rystad Energy, he obtained an MSc in economics from the University of Bergen, Norway.