Gulf of Mexico remains cornerstone of North American gas supply

One looming question facing tomorrow's gas industry is where supplies will originate to satisfy the widely touted 30 tcf US market. Fortunately, for surging US gas markets, the two top North America supply sources exist at its borders: Canada on the north and the Gulf of Mexico on the south.
This geographical relationship positions each contributor equidistant from key northeast and middle Atlantic gas markets and ensures a competitive balance to meet incremental supply requirements. Meanwhile, onshore domestic production prospects remain positive for all but a few supply regions.
Intense supply competition between the two top regions will occur based on availability of pipeline capacity, resource economics, and price competition. The big winner will be the gas consumer who will be assured a steady gas supply at competitive prices. The GRI (Gas Research Institute) expects future gas supply to unfold as follows:
- Total US supply (production and imports) will increase from 21.8 tcf to 32.0 tcf by 2015, an increase of over 10 tcf.
- Gulf production will increase from 4.9 tcf in 1998 to 8.1 tcf in 2015. This 3.2 tcf growth in production represents the single largest source (29%) of incremental gas supply in North America.
- Canadian production will expand by 2.1 tcf in the same period, and is the next largest contributor, accounting for 18% of incremental supply. Increased Canadian production enables US imports to grow another 1.3 tcf, exceeding the 4 tcf threshold.
- Onshore Lower-48 production will expand by 5.7 tcf, with the Rockies/Overthrust area contributing 1.9 tcf, or nearly one-third of the total gain.
Supply Backbone
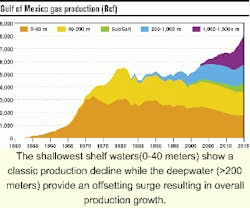
For the US, the Central and Western Gulf has traditionally been the largest gas supply contributor and this relationship is expected to continue. Much has been heard about accelerating production decline from offshore wells. This observation is based upon production data from wells on the shelf, the oldest producing area in the Gulf. When discussing supply characteristics and potential, a distinction needs to be made between the shelf and deeper parts of the Gulf.
The accompanying chart presents an overview of Central and Western Gulf production by water depth interval. Shelf production is illustrated by the two bottom water depth intervals on the chart. The chart shows that there has been erosion in shelf production. This decline has primarily resulted from recent gas price conditions that have affected drilling, as well as a continued decline in average reserve size and productivity. However, the shelf has not collapsed and continues to be the focus of considerable development activity.
Shelf potential
The shelf production decline has primarily been in the 0-40 meter water depth range during the 1990s, aggregating to nearly 0.7 tcf, including 0.2 tcf during the most recent industry slump. Historically, the greatest production drop in this depth range was 0.4 tcf in 1983. Production from this water depth range is projected to continue declining.
Correspondingly, the 40-200 meter water depth range held nearly constant during the 1990s at approximately 2.0 tcf annually. This range also saw a drop amounting to 0.2 tcf during the recent industry slump. The decline is in line with historical experience where the maximum previous decline was 0.4 tcf in 1986. Production from the 40-200 meter depth range is projected to remain nearly constant in a range of 1.8-2.0 tcf.
Overall, GRI expects continued decline in shelf gas production. Most of the decline is anticipated in the 0-40 meter depth range. Production in that depth range is projected to decline by 0.6 tcf between 1998 and 2015, while production from 40-200 meters is projected to hold relatively constant. However, total Gulf production continues to grow, as the shelf forms a base for a rapid increase in emerging deepwater production.
Overlaying much of the Gulf of Mexico is the subsalt play. This emerging play represents a fresh technological frontier that promises to extend the life of the shelf for additional years, as knowledge and success rates improve. From a practical standpoint, most of the subsalt exploration will occur in the shelf area where drilling costs are less and platform and pipeline infrastructure is established. Due to the active learning curve of this "high tech" play, significant results are not expected until late in the projection period. A pickup in subsalt production volumes between 2007 and 2015 provides added support for the shelf, with production reaching 0.7 tcf annually.
Deepwater potential
Deepwater production is projected to continue increasing. The 200-1,000 meter interval is yielding excellent results. GRI expects production from this interval to double from current levels, peak by 2008 at 1.4 tcf annually, and hold in that range throughout the projection. The 1,000-1,500 meter plus range is expected to grow from relatively small volumes today to almost 2.4 tcf by 2015. - The Ziff Energy Group study gathered information on seven Gulf of Mexico strategy areas.
The deepwater interval encompasses a huge area of 68,600 sq miles, or 47% of the Central and Western Gulf. By comparison, the shelf, which has been under constant exploration for over 50 years, covers approximately 62,000 sq miles, or 42% of the Gulf. Deepwater areas of the Central and Western Gulf contain a substantial portion of the assessed Lower-48 undiscovered potential. The current GRI assessment is 9.7 billion bbl of liquids and 140 tcf of gas.
Eastern Gulf
The Eastern Gulf, which includes all areas offshore from Mississippi, Alabama, and Florida, is modeled separately by GRI. The Norphlet play is well established. Like some other Lower-48 supply regions, the Eastern Gulf has faced access restrictions and most areas outside the Mobile Bay area are presently "off limits" to exploration and production. - Finding and development costs for participating companies active in the central Plio/Pleistocene.
The Eastern Gulf area includes over 161,000 square miles, or 52% of the entire Gulf. The GRI projection assumes that current access restrictions continue indefinitely. However, if current policy changes, activity and production could expand substantially and the region may eventually compete with the deepwater play as a frontier area.
Canadian imports
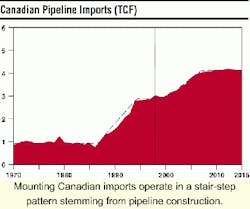
The other key pillar of gas supply will be Canada. In the near term, Canadian pipeline imports are expected to increase steadily, growing from 3.0 tcf in 1998 to more than 4.0 tcf by 2007. Of particular note is the "stair step" pattern depicted by the dashed line in the accompanying figure. Canadian imports have traditionally been constrained by available pipeline export capacity, and new pipeline capacity tends to be added in large chunks.
As the illustration shows, production grows gradually, filling the new pipeline capacity, and then flattens out until the next pipeline expansion can be justified. Presently, Canadian gas markets are in the midst of a pipeline building boom under which export capacity is increasing as various pipeline projects are finished. Once completed, history is likely to repeat itself, and production will expand to fill the new lines.
Presently, net pipeline imports account for almost 15% of total US gas supply. By 2005, expanding imports will account for 17% of US gas supply. However, after 2007, pipeline imports are expected to level off in a range of 4.0-4.2 tcf. This "topping out" reflects limits on pipeline capacity, and stiff competition from growing Lower-48 production, not Canadian resource constraints.
The volumes needed to fill the new pipelines will represent a significant increase in Canadian production. Production will expand by 2.1 tcf over the projection period to a level approaching 8.0 tcf. However, Canadian gas demand is expected to also increase by 1.0 tcf during that period, implying that nearly half of the production gain will need to remain in Canada.
Most of the Canadian production growth will stem from the western provinces, which include the prolific Western Canadian Sedimentary Basin (WCSB). This basin spans a large portion of western Canada, extending from the Williston Basin on the southeast to the British Columbia foothills and the Fort Liard area on the northwest. The envisioned production levels will rival those of the US Gulf, thus setting up a supply "tug-of-war" to be played out over the years.
One of the most exciting developments recently has been several large gas discoveries in the WCSB's Fort Liard area. It is anticipated that gas transportation capacity from this region will increase rapidly and allow activity to move incrementally northward. GRI's latest projection for the WCSB suggests that by 2015, annual production will eclipse the 8.0 tcf mark.
Production from eastern offshore Canada is projected to grow from zero in 1998 to 0.6 tcf over the next 15 years. For Eastern Canada, reserve additions are projected to greatly exceed annual production in the 2005 to 2010 period. One bullish wild card in the Canadian supply picture is the presence of large frontier areas with excellent potential, particularly Mackenzie Delta and eastern offshore basins. Once developed, these frontier areas have the potential to dramatically increase supply, resulting in overall Canadian production increasing beyond levels suggested here.
Onshore domestic
For the onshore Lower-48, 14 of 16 supply regions exhibit increased production with the Rockies/Overthrust region leading the way. Rockies/Overthrust production expands from 1.4 tcf in 1998 to 3.2 tcf by 2015. Despite new pipeline projects over the years, production grows so rapidly that pipeline capacity will not always keep up, meaning that the region will often continue to be pipeline constrained eastward, and won't be able to significantly tap the lucrative markets captured by Gulf and Canada gas.
However, the good news for this region is that there will be significant growth in local gas demand and the area will operate as a self-contained supply/demand region. Other expanding supply regions include the Appalachian Basin and Arkla-East Texas where production grows by 0.7 tcf and 0.6 tcf , respectively.
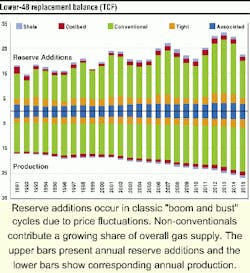
Lower-48 additions
What are noteworthy about reserve additions are the surges in which new reserve additions have been added over the years. This condition is expected to persist, following the characteristic boom and bust cycles of the petroleum industry. Reserve additions trend higher over time with the fluctuations attributable to oscillating gas prices setting up the boom and bust cycles. For the supply process to remain viable, there must be relative symmetry over time and additions must exceed withdrawals.
As the supply balance shows, by type of gas, the largest share of increased production is from conventional gas and the Gulf contributes about one-third of that amount. Non-conventional gas production (coalbed methane, shale, and tight gas) grows near the end of the projection period. By 2015, reserve additions for coalbed methane and tight gas expand significantly.
Although the future supply challenge will be formidable given the manpower, access, and capital challenges facing the industry, the undertaking is expected to be achievable. The 30-plus tcf anticipated domestic demand will be met through contributions from all production regions, and from all types of gas.