Studying seismic pattern recognition efficiency of geoscience experts
Editor's Note: Because of the large volumes of seismic data now available for interpretation, new ways of scanning and interpreting the data sets are needed. This article explains some of the work being done to identify the seismic interpretation process used by experts with the goal of improving interpretation productivity.
In many fields where visual perception plays an important role, analyzing visual behavior can be fruitful. Thus was the case in radiology, machine supervision, human-machine interfaces, and other fields. The interpretation strategy of the specialists was improved, and a model of visual perception defined to implement algorithms (psycho-mimic algorithms) to help specialists in their task.
Our study concerned the interpretation of seismic images. Interpretation brings into play two parts: the geologist and the image. Our work was about understanding the visual relationship between the seismic section and the geologist. We wanted to understand human visual perception during seismic image scanning.
By analyzing visual behavior, we can improve the interpretation strategy of novices and specialists in seismic observations, and we can help the specialists in their task by implementing psycho-mimic algorithms that imitate partially the seismic interpretation process.
Viewing the image
When we observe an image, our visual pattern looks like a discrete process composed of fixations, which are separated by saccades. Fixations are periods of about 400 ms, corresponding to relative eye immobilization. During this period we acquire, memorize, and process the visual information. Moreover, fixation duration and place depend on physical factors such as: semantic (meaning), contrast of the objects in the image, and behavioral factors.
The saccades are quick jumps of the eye from place to place. Their amplitude is about 2-3
However, it has been proved that vision is essentially suppressed during saccades. There-fore, we suppose that information processing takes place during the fixations. We noticed that the image projection of the fixated zone is localized on the fovea. That is why the fixations are an unbiased parameter to measure viewer activity.
Scanning method
Our methodology is composed of two parts. First, ocular index was measured to understand the schema used by geologists during seismic data observation. Results were used to improve the seismic image processing algorithm.
Our aim is to learn where geologists cluster their fixation and what kind of seismic image index attracts their gazes. Second, we wanted to establish the correlation between ocular index and image index.
The experimental setup is composed of a head free-eye tracker and a screen on which the seismic blocks are displayed and controlled. The technique of eye-gaze tracking is based on corneal reflexion. An infrared (IR) camera records both the pupil and the reflexion of the IR spot on the cornea. Both the center-of-gravity of the pupil and the corneal reflexion provides the direction of the gaze. The direction of the gaze is sampled at a frequency of 50 Hz.
For the experiment, we used six 3D seismic blocks from different geological surveys. Each block contains 200 images. Block 6 contains no evident important structure versus other blocks, which contain "pop-out" structures. The seismic blocks are viewed like a video sequence where the inline direction becomes the direction of animation. In other words, we animate the different seismic slices in sequence. The blocks are displayed on a user-interface offering navigation through the block at different speeds.
Observer results
Nine observers were tested: five geologists, two geophysical specialists in seismic signal processing, and two novices in seismic observation. The subjects discovered the images for the first time, and they had never seen the animated seismic block.
The observers were instructed that the blocks had already been interpreted and that important geological structures were extracted. Next, they viewed the same block in four different ways: first, they examined one 2D section, and then they explored the animated block at three different speeds (rate frames) - 20 Hz, 10 Hz, and 2.5 Hz. The duration of each exploration was about one minute.
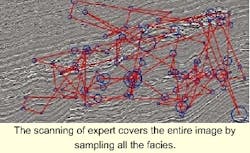
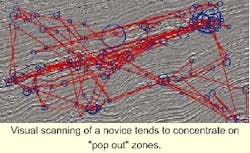
Measurements gathered from the oculometer are the successive positions and durations of the stay of the gaze. With regard to the visual scanning of different subjects, we noticed an important difference between the scanning of the geologist and the novice:
- With experience, the scan seems to cover the entire image by sampling all the facies. The scan seems to be organized as forward and backward motions between different seismic structures. The expert looks back to informative regions.
- The novice tends to concentrate its gaze on "pop out" zones like chaotic regions versus parallel regions and on energetic structures.
Geologists found that "structure motion" (animation) allows them to access a general view of the block in a rapid way. Moreover, the mean fixation duration is longer during animation viewing (370 ms during static mode versus 470 ms during animation mode) and the proportion of long fixations is more important during animation observation.
We suppose that animation supports long fixation. This can be explained by the fact that structures, until then difficult to identify on a seismic section (like a fault), are easier to extract with animation and they attract the observer's gaze.
Furthermore, by examining the fixation duration used to block observation, we noticed that exploring the static image presented a statistical modal class greater for block 6 [300, 400] than for block 1-5 [200, 300]. We suppose that the lack of seismic structure induces long centration (because viewers attempt to include the entire image, looking for possible important structures) and it induces scrutiny. The geologist scans the image in a regular way. Moreover, we noticed that the fixation durations are perceptibly greater for the two more experienced geologists.
Geologist's fixations
We studied the visual behavior of geologists faced with seismic images. We brought out fixations zones and characterized these zones of interest by an image index. We chose textural features and motion estimation, which we thought was well adapted to the seismic images.
By coding the fixation zones with an image index, we hope to reproduce the visual exploration of the seismic images. The selected attributes to detect and characterize seismic structures need to have physical (visual) and geological meaning. They must be discriminant.
When a geologist performs an interpretation of a seismic block, he analyses the morphology and the nature of the sedimentary deposit. In this way, he identifies different seismic facies, defined as a group of structures with same parameter (energy, discontinuity, etc.). For example, texture analysis constitutes a good characterization of seismic facies. The texture model we chose is based on second order statistics as proposed by Ma and Gagalowicz. Features are extracted from the histogram and the auto-correlation.
We introduced a method to better understand seismic interpretation based on ocular observation of geologist's eye behavior. In addition, we tested an interpretation method based on animated seismic blocks to improve and accelerate seismic structure exploration.
Our results are coherent with previous studies in similar domains such as radiology. The next step is to implement elements of the results in a visual model capable of partially imitating visual exploration.


