Digital twins supporting risk-based decision making for offshore installations
Zoe Wattis, Paul Murray, Brian Bain, Cynthia Spitzenberger, DNV GL
Quantitative risk assessments (QRAs) have long been used in the oil and gas industry, both offshore and onshore. They allow safety professionals to assess the impact of alternative designs, changes during operations, and compliance of installations against their company’s criteria. These snapshots of operations gave an insight into a moment in time, essentially a static picture of what is happening on an asset.
With the influence of digital technologies, cloud-based tools, such as DNV GL’s MyQRA and Cloud QRA, can be used to develop living QRAs which can be updated throughout the lifecycle of an installation. It means project stakeholders can shift operational parameters to show exactly how changes impact other functions of the asset. This is done by creating a digital twin.
Making a copy
A digital twin is a real-time simulation of a physical asset that uses multiple sources of data to ensure it is updated to reflect changes to the physical asset. Such a concept is increasingly being discussed across a wide range of industries. They bring significant benefits for the management of data and decision-making, providing a consistent single true source of evidence.
As the oil and gas production and processing industries have not fully grasped digitalization, there remains a reliance on paper documents, drawings or partial models created for specific tasks. There is not always a coherent linkage to similar data sources which can lead to inconsistencies or duplication of effort. In addition, there is not agreed formats either, with every operator or engineering firm choosing its own software and practices. The need to improve efficiencies and reduce costs has prompted the industry to consider the course required to reach a viable digital twin model.
Rebooting QRA standards
For safety engineers working to model hazards, the studies required as part of the QRA process are generated through a range of engineering disciplines. These include process, electrical, structural, weather, marine and manning, often shown in the form of layout drawings, 3D models, 2D plot plans and tabulated data. The QRA process is therefore ideally placed as a starting point for a digital twin.
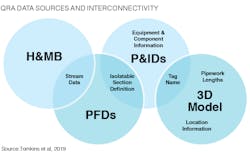
Data management practices influenced by the QRA process provides a framework for shaping a data structure which crosses several engineering disciplines and offers a standardized format. By separating out the hazard modeling from the data storage, the QRA database becomes the ‘single source of truth’ with the hazard modelling merely becoming one of many different data manipulation processes applied to the data.
A range of initiatives, not unique to QRA, can be extrapolated to modernize QRA processes and include data collection, interpretation, storage, processing and results presentation. Collectively, these identify a path towards a digital twin.
Currently, the QRA process requires the collation of several sources of data, running models and producing outputs in static reports to assess the total risk presented by a facility or operation. These typically summarize the detailed work undertaken and return high-level results which are compared with tolerability criteria or to demonstrate ALARP (As Low As Reasonably Practicable).
Development of cloud-based tools to support the QRA process can turn the traditional static QRA into a dynamic online living QRA which can be updated throughout an installation’s lifecycle by creating a digital twin. The collated input data is used for several aspects of the QRA process.
Reinventing the model
There are a range of drawbacks which are inherent in using the traditional approach to set up the static QRA model. Data can be easily missed in manual processes such as parts counts or isolatable section identification. As interpretation of the data may be subjective, audit trails can be put in doubt and reporting is not always intuitive to the non-expert. This can result in inaccurate reports, incomplete or unclear data and reanalysis.
The key to improving the current process is understanding the flow of data required between the process design engineers/operators to the risk analyst and other technical disciplines with the aim of developing techniques to automatically convert data from one form or structure to another.
Digitalizing and standardizing this data can be grouped under the following innovations:
• Data capture - mapping of the available data into a suitable format
• Data hub - Storage of relevant information for an asset in a centralized cloud location
• Data results - interactive results for stakeholders to use in decision-making.
Bringing it to life
DNV GL has previously managed offshore QRA data using a central database on a network server, ensuring continuity and consistency through the lifecycle of the asset. This route was developed to allow multiple users access to a central database running validated consequence and risk models remotely. This remains fundamental to the digital twin approach.
This central database allows DNV GL the ability to access a QRA model created in the system at any point in the last 20 years from a central location. In this approach, version controls are in place to track changes as an asset evolves and build up a timeline of the QRA. Users can access any of the inputs and perform intermediate calculations and results in formatted structures from the database using query language.
Using this format for managing offshore QRA data has informed the technical advisor’s response to the changing digital landscape, and as such, a significant development program has been undertaken to transfer QRA tools into a cloud environment. A database and analytics engine were moved to the cloud, with a web interface replacing the desktop interface. The cloud server now provides both storage and processing capacity under a managed network where all data is backed up automatically on a regular basis. This ensures there is no data loss in the case of server failure and continuity of the data, assumptions, and output maintained. The project has established the foundation for the data hub and use of the cloud environment has gained the flexibility required to meet several needs.
Interactive dashboards are increasingly being used to display aggregated metrics that can be used to ‘drill down’ into the detailed results to provide insights in a way that is not practical in a static report. This concept is perfectly suited to QRA results since these are often amalgamations of thousands (or millions) of simulation cases describing the combination of circumstances that may exist in an accident. Dashboard software can be linked directly to the data hub to provide a meaningful snapshot of the assets, consequence and risk data that can be interrogated down to fundamental levels particularly if the data lies within hierarchical structures.
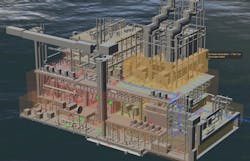
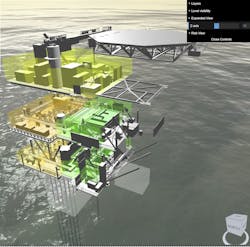
In addition to dashboards, visual representations of the data can be used to provide an increased understanding to the non-expert. For example, using contour plots to understand where hazards are concentrated, or 3D representations of a hazard. Similar to the interactive dashboards, these visuals can take slices of data from the hub and be viewed via a standard internet browser.
In addition, since some of the information has been defined spatially (e.g. critical locations), the 2D and 3D visuals can be used as a means of navigating results, by selecting the point of interest, and pulling out the information of interest to that point.
Case study
Cloud QRA has recently been used to support an operator in the US for the risk evaluations for several of its facilities. They were attracted to the cloud solution given the online access and on-demand ability to review the input and output data related to the QRA. The interactive dashboards allow them to drill down into the finer details and results which would not be available in traditional reporting. The numerous results related to a specific part of the process or area could then be used to make more informed risk-based decisions.
There is potential to improve the dashboards to make sure the information required by various stakeholders is readily available and comprehensible. Some client users are experienced risk analysts able to easily comprehend the detailed information presented; others have only a high-level comprehension of risk metrics and are more interested in summary information. The ability to customize the output to match the needs of a given stakeholder is a strong feature of the system.
Overall, the digital twin concepts allow a wider range of stakeholders to determine risk drivers, isolate accident scenarios, and filter results to a greater depth than is possible through a paper report and allow a greater understanding of their hazards. Reducing the time to collate data, perform analysis, and enhance the tools available to report results means that decisions can be made more rapidly, increasing the efficiency of analytical processes for the whole asset lifecycle. •
References
1. https://www.dnvgl.com/oilgas/perspectives/boosting-the-business-value-of-risk-assessment.html


