GEOSCIENCES: PART I: "Vapor-lock" geopressure seals observed in seismic evaluation
PART I: This is Part I of a two-part series on a seismic velocity technique for geopressure detection, with emphasis on research done on West Cameron Block 66 in the Gulf of Mexico. Part II, appearing in February, will focus on the modeling behind the technique.
Dynamically supported pressure seals appear to control how fast and in what direction fluids move through young deltaic basins like the US Gulf Coast. Such seals are dynamic in that they are maintained by a slow, ongoing flow of formation fluids containing dissolved gasses migrating out of the deep basin.
When these gasses come out of solution in a shale section, further fluid flow is restricted, and pressure builds up below the resulting seal. This is the basic idea behind the "vapor-lock" concept of seal formation.
In 1999, the US Department of Energy funded a research project to look at geopressure seals under a typical Gulf of Mexico gas and oil field - West Cameron Block 66 Field (WC 66). The goal was to delineate the relationship between hydrocarbon reservoirs and the geopressure "structure" in and around the field.
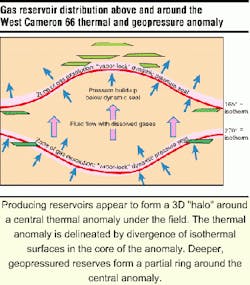
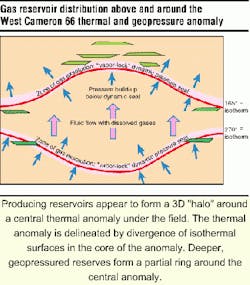
The key observation of this part of the project was that pay zones appear to form a three dimensional halo around a thermal/geopressure seal anomaly located in the center of the field. This is consistent with the idea that pay distribution here is largely controlled by fluid migration associated with the breach of a deep pressure seal and a resulting up-bowing of shallower, dynamically supported (vapor-lock) pressure seals.
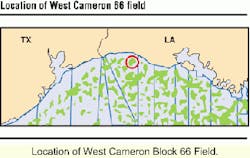
WC 66 Field is primarily a gas-producing field located 12 miles offshore of southwest Louisiana. It has produced over 250 bcf of natural gas, plus associated oil and condensate. Producing zones are Middle and Lower-Middle Miocene in age.
Production from below the casing point (12.5 lb/gal. drilling mud weight) occurs in the Marginulina ascensionensis (Marg "A") biostratigraphic zone. Depositional environments for the sand reservoirs in the region range between upper bathyal to middle-neritic water depths.
Solubility minima
The most informative property mapped in the project was the distribution and geometry of isothermal surfaces. Previous laboratory and numerical modeling work indicated that dynamic or vapor-lock pressure seals can be expected to develop at roughly 73 degrees C and 132 degrees C due to two solubility minima expected from a gas mixture of 75% methane and 25% carbon dioxide. Mapping of these two isotherms at WC 66 does show a relationship among pay distribution, well-log property inversions, and seismic interval velocity gradients.
Hydrocarbon distribution forms a 3D "halo" around a central thermal anomaly under the field. Shallow accumulations occur above and in contact with upper seals, generally above the core of an apparent thermal anomaly. Deeper geopressured reserves form a partial ring around the central anomaly.
Formation of multiple sealing intervals appears to be characteristic of this region of the Gulf Coast Basin. Changes in seal geometry are probably indicative of dynamic fluid flow processes at work. Identification of multiple pressure seals in the WC 66 area is consistent with repeat formation tester (RFT) pressure measurements from the adjacent East Cameron area.
RFT measurement
A similar multiple-seal distribution is seen in RFT pressure measurements in the nearby East Cameron 64 (EC 64) Field, 21 miles to the southeast. These indicate the presence of two geopressure seals separated by approximately 2,500 ft. Unlike pressure inferred from log and seismic data, RFTs directly measure actual pore pressures.
Limited temperature data from this well, the Mobil EC 64 #A-7, suggests that the upper seal forms at temperatures less than 100 degrees C and that the lower seal has formed at approximately 125? C. These roughly correspond to the solubility used in this project's numerical modeling work (discussed more completely in Part II).
"Out-of-phase" upper and lower seal geometries produce diagnostic signatures in well log and seismic interval velocity properties that arise from pore pressure and effective stress. The "out-of-phase" thermal anomaly at this field is represented by the divergence of the 165 degrees F and 270 degrees F isotherms.
The figures give some sense of the 3D structure forming around the thermal anomaly. The area of greatest isothermal divergence occurs under the center of the WC 66 Field. Both isothermal surfaces cross stratigraphic boundaries, indicating support by a dynamic fluid-flow mechanism.
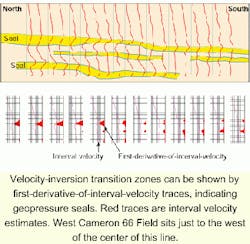
One way to display pressure-related seismic signatures is by showing zones of interval velocity reversal with first-derivative-of-velocity traces. Interval velocities in this project were estimated from seismic stacking velocities calibrated to available wells using the calibrated-velocity-volume method implemented in the SeisBase III software.
In practice, several data sources such as shale resistivity and density logs, bottom-hole temperature measurements, and seismic attribute clustering have been used to check and support each other in mapping seal geometry.
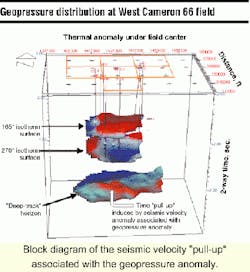
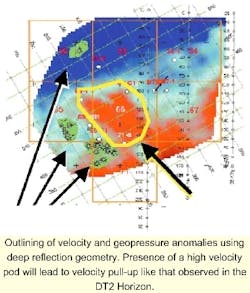
Strong deep reflections such as the "Deep Track" horizon (DT2) may provide clues to velocity and geopressure anomalies in the section above them. Some of the time-relief on such reflections may be due to seismic velocity "lensing" in the shallower section. Velocity and geopressure anomalies can be outlined using deep reflection geometry. Within diverging-seal geopressure anomalies, bulk sediment density and seismic velocity are slightly greater than in the geopressured section surrounding the anomaly.
This results in a time pull-up of reflections below the anomaly. The outline and amount of time relief on these deep reflections gives clues to the size and shape of the overlying anomaly. Time-sags in deep reflectors would result from non-divergent and single-seal geopressure anomalies.
Conclusions
WC 66 Field offers a good example of how "geopressure structure" helps control the occurrence of oil and gas reservoirs in a young deltaic basin. The field formed around a fluid-flow anomaly that can be detected through seismic velocity analysis, well bore sonic logs, well check-shot surveys, well logs related to shale density trends such as shale resistivity, and temperature mapping.
Useful techniques applied to this data set include first-derivative-of-interval-velocity displays, multi-attribute seismic analysis and display, the calibrated-velocity-volume process, and well log suites used to confirm overall data trends in an area of complex seal geometries.
The gas component mixtures present are probably somewhat different from the 75% methane-25% carbon dioxide mixture used in the theoretical modeling. The inferred seals and observed pay distributions have the right shape as, but do not usually occur directly, at the mapped isothermal surfaces.
The fact that some of the detected seals cross stratigraphic boundaries may be the best indication yet that dynamic fluid-flow seals such as those postulated, numerically modeled, and physically modeled do in fact exist.
This geopressure mechanism may prove to be a fundamental factor in the creation of oil and gas fields in many basins around the world where active hydrocarbon generation and conversion is an ongoing process. Modeling of rock mechanics across "vapor-lock" pressure seals has suggested a relationship between seal formation, sediment deformation, and the location of growth faults.
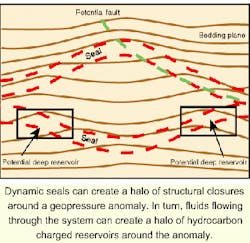
Because of the dynamic nature of the seal, relative gradients in compressive forces increase just above the seal and decrease just below the seal. This means that structural closure due to differential compaction can be created during seal formation. The geometry of the seals can create a "halo" of structural closures around a thermal anomaly that in turn creates the "halo" of hydrocarbon charged reservoirs observed around the anomaly. Based upon the geometry of the lower seal, deeper, potentially new reservoirs can be predicted.
Understanding dynamic seals can improve basin analysis, geochemical modeling, fluid migration modeling, and structural modeling in growth fault regions. Improvements in geopressure prediction for well drilling are also expected, at least in terms of knowing:
- What kinds of over-pressure anomalies are to be expected
- How these anomalies can form and be maintained in the subsurface.
At WC 66, 2-4 geopressure seals are detec-table with seismic and well logs. Seal geometry reflects thermal distribution as predicted by vapor-lock theory. Hydrocarbon distribution appears to form a 3D "halo" around the central thermal anomaly under the field. Indirect detection of geopressure anomalies appears to be a productive approach for exploration and field extension.
Acknowledgement
Support for this work was provided by the US Department of Energy. This report summarizes research into the relationship between hydrocarbon accumulation and dynamic pressure seal formation. The work was performed by the Idaho National Engineering & Environmental Laboratory and EarthView Associates, Inc. in March through September 1999 utilizing seismic and well data supplied by Conoco Inc. Supply of this seismic data should not be construed as endorsement of the validity or effectiveness of these results and proposed methods. The following colleagues provided valuable discussions and insight: Alan Huffman of Conoco, Tim Green of the Idaho National Engineering and Environmental Laboratory, Hal Adams and Mike McCardle of Adams & Starr, Geophysicists, and Reddy Ravula of AlphaGeo, Inc.
References:
Benzing, W., 1994, The 'vapor-lock' pressure seal: poster abstract in AAPG Hedberg Conference, Denver, Colorado, June 8-10, 1994.
Benzing, W., 1998, Shale response to the Formation of "Vapor-Lock" Pressure Seals: A Dynamic Geomechanical Model; IADC forum - Pressure Regimes in Sedimentary Basins and Their Prediction.
Benzing, W., Shook, G., 1996, Study advances view of geopressure seals: Oil and Gas Journal, v. 94, no. 21, May 20.
Benzing, W., Shook, G., LeRoy, S., 1996, Formation and behavior of 'vapor lock' pressure seals and associated hydrocarbon accumulations in geologically young basins; Gulf Coast Association of Geological Societies Transactions, v. 46.
Kan, T-K, Kilsdonk, B., West, C.; 1999, 3-D geopressure analysis in the deepwater Gulf of Mexico: The Leading Edge, April 1999.
Shook, G., LeRoy, S., Benzing, W., 1998, Reservoir and Geophysical Properties of Vapor-Lock Pressure Seals. In: Pressure Regimes in Sedimentary Basins and Their Prediction; AADE Forum.
