REGIONAL EXPLORATION: Predicting deepwater turbidite reservoir quality and geometry
Exploration and production from deepwater sandstone reservoirs globally has shown that traditional geological models are inadequate for predicting reservoir facies and quality. This is particularly true for West Africa and offshore Brazil, where applic-ation of geological information has not always led to successful prediction of reservoir facies distribution.
An understanding of sedimentary processes occurring within individual turbidity currents, and their deposits as seen in the rock record, is a critical part of understanding issues of reservoir quality, such as connectivity, facies heterogeneity, and distribution.
These geological visualizations, based on combinations of fluid dynamic theory and rock outcrop analogy, are rarely of direct use in reservoir facies prediction on an exploration scale. This is particularly true when the limited number of geometric bodies (or architectural elements), such as channels, amalgamated sheets or lobes occasionally fail to match predicted reservoir behavior, or volumes of predicted reservoir prone facies.
Seismic sedimentology
As a result of the recent development of 3D seismic attribute technology, along with image processing and other visualization techniques, sedimentary body architecture in deepwater sandstone reservoirs appears interpretable directly from the seismic data, without the need for as much analogue data application. Techniques ranging from direct interpretation of reservoir facies from seismic, combined with AVO analysis and other direct evidence for hydrocarbons, might tempt many workers to rely solely on seismic for prediction.
This becomes frustrating when the number of "geobodies," or enigmatic shapes seen on time slices through 3D volumes, exceeds the known or standard architectural shapes that we know from subsurface or outcrop analogues. The temptation is to then interpret new elements directly from the seismic without the comfort of an integrated geometric database.
The technological advances in subsurface visualization have been matched in the oceanographic world by the resolution of sidescan sonar data. Much of this data has control on backscattering information, in shallow gravity coring. Deep-towed sidescan sonar in particular, operating at high frequencies, produces acoustic images of the seafloor and shallow subsurface, which overlap directly in scale and resolution with 3D attribute analysis of subsurface volumes.
Since the early 1990s, data of this type have been collected on research cruises dedicated to the study of modern sand-prone turbidite settings. The range of sand body geometries observed on the sea floor has been calibrated directly with sedimentary cores.
In short, modern seafloor data from selected parts of modern systems can be combined with selected 3D data to produce exactly such a geometric database. Backscatter data calibrated with sedimentary "ground-truthing" may now be validated with subsurface data (e.g. amplitude maps) to test reservoir facies distribution.
Narrowing the analogy
We can observe spectacular images from 3D volumes that are geometrically similar to sidescan sonar and other modern data. Why are we not routinely validating our interpretation of sand body geometries from the subsurface with this modern data? One area of resistance is that there may be lack of basin history, and thus sediment quality analogy, between subsurface and modern data.
From a sequence stratigraphy angle, most significant turbidite reservoir facies accumulations in the subsurface are a product of sea level lowstand at various points in the past, whereas most modern systems are developing in a relative highstand and are dislocated from sources of good quality sand.
The first statement is undoubtedly true for many subsurface accumulations of sand; there are a number of problems with the second. During prolonged sea level highstand, systems will grade back to a lowstand profile very rapidly by repeated mass-wasting or rapid progradation of deltas to the shelf break, re-establishing direct pathways for good quality sediment from fluvial systems into deepwater.
This is the case for many systems off West Africa, and even the largest passive margin turbidite fans are now characterized by widespread and rapid sand deposition. Further, by targeting specific modern systems, which are known to be active sites of turbidite sand deposition, the search for the analogy is a dedicated one, and a very strong component of a geometric database dedicated for validation with subsurface shapes.
A second problem is access to such high-quality modern marine data. Much of the data is not in the public domain, and much of what is available readily may not match sufficiently with subsurface issues, with some notable exceptions (HARPS). To resolve this, research which combines expertise and access to modern, ancient, and subsurface data should be encouraged within Gulf of Mexico exploration and production to produce validated predictive models for reservoir facies distribution in the subsurface.
West Africa deepwater
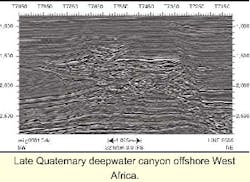
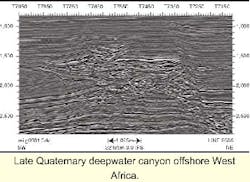
Deepwater canyons of Late Quaternary age have not been systematically used in deep offshore exploration to characterize reservoir geometry and quality until recently. Here, channeling in both modern and subsurface examples shows a range of features at a variety of scales. - A transverse profile across the main canyon head area near the neck of the cauliflower area. Gravity cores show accumulations of slumped material in the canyon floor (red), underlain by sand, and thin sands in the terraces and over-bank area of the canyon (yellow).
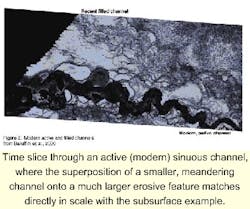
They vary from large, multiphase occupancy, long-lived erosional features to smaller, leveed (often monoreflector) superimposed, sinuous channels. It appears that the processes in operation now, both inside and outside these channels, are the same as those that operated on filled, prospective canyons in the subsurface.
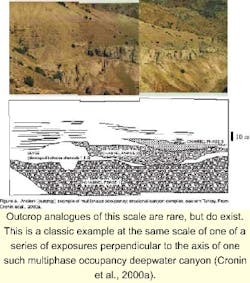
Outcrop analogues of this scale are rare, but do exist. The geometries recognized within the seismic data can then be compared with those observed at outcrop. Issues that can be resolved during such a comparison are:
- The smaller (phase 2) siting of the levee channel on the larger canyon complex is sited near its thickest part.
- The sand-on-sand contact between both channels is restricted to the central part of the second channel, as there is significant mud accumulation between the two channel phases during levee growth.
- Channels continue to re-incise into the main axial parts of older channels, separated by periods of mud accumulation. This is accompanied by a decrease in grain-size through the younger channels, until the highest channel is mud-plugged.
These characteristics may be an indicator of lithology, but without direct core evidence from the subsurface, they will not be direct indicators of reservoir facies quality.
In summary, outcrop analogues can usually be used as a library of geometries that can validate modeling of subsurface geobodies, but there will be a range of facies distribution for each of these shapes. Further validation requires a combination of seismic facies analysis from sub-surface 3D with ground-truthed modern data, where similar shapes are also visualized.
Ground-truthed data
"Ground-truthing" is a standard way for marine geologists to calibrate sidescan sonar acoustic facies with sediment type. High backscattering on sonographs generally mean either coarse sediment, topography facing the towed instrument, or rough sea floor. Low backscattering generally indicates that the sea floor is absorbing acoustic energy, and is usually fine-grained sediment or topography facing away from the instrument.
Fine-grained clean sands may produce low backscatter (as they absorb acoustic energy), and muddy debris flows may produce high backscatter (because they have rough surfaces). A muddy sea floor is characteristic of low backscatter, and coarse sand or gravel characteristic of high backscatter.
For deep-towed, high frequency (shallow penetration) sidescan sonar tools, these facies can be quickly tested using shallow gravity cores. The result is a series of planform images (sonograph mosaics) of parts of the sea floor, where backscatter pattern types resemble optical images and where the different shades of grey have been calibrated to lithology.
These high resolution tools produce superb images of different seafloor architectural elements, such as: dunes, channels, levees, terraces, crevasse splays, and canyons. These are at a scale that is beyond the control of even the most exceptional outcrop where surfaces have to be inferred in three-dimensions. Once the facies have been calibrated with sediment type, and the shapes of these bodies found analogous to shapes recognized on amplitude displays and timeslices from 3D data, the sonographs can be redisplayed to show the potential reservoir facies of interest.
Examples
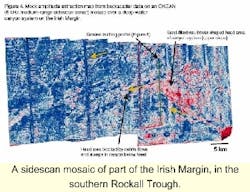
Shown is a mosaic of part of the Irish Margin, in the southern Rockall Trough, which was surveyed in late summer 2000 using the medium-range sidescan sonar tool Okean (6.5 kHz, up to 10 meters penetration). The survey was gathered on training-through-research Cruise 10, and then ground-truthed using 3.5 kHz and 7.5 kHz profiler (showing sea floor topography), deep-towed ORETech sidescan sonar (100 kHz, <0.2 m penetration), and a 6 meter gravity corer.
The mosaic covers an area that extends from the upper slope down to the upper rise, a downslope area of almost 50 km. The area is characterized by a series of tributary deepwater canyons, which feed downslope into a sandy basin floor fan.
At the present, the slope is dominated by very active downslope processes, almost all muddy debris flows and slumps, which have choked the neck of the canyon system just below the cauliflower-shaped head area. Little sand is getting into the system now, as there is no fluvial system for the canyons to eat into headwards. However, such sand as is present is getting into the system (red colors) from the shelf, is being ponded in the head area (blue colors), and then is being covered with more debris flows and slumps.
Also shown is a transverse profile across the main canyon head area near the neck of the cauliflower area. Here a series of gravity cores show accumulations of slumped material in the canyon floor (red), underlain by sand, and thin sands in the terraces and overbank area of the canyon (yellow). These ground-truthed sediments have been calibrated to the sidescan mosaic to show the sand under the debris flows and slumps for the upper 10 meters of sedimentary cover.
The result is a mock amplitude extraction display for a large area of the middle and upper continental slope, which shows the position of sand in the system for the 10 meters to 2 meters time slice. The combination of modern geometric data and lithotype distribution from the modern sea floor now allows direct comparison with time slices from selected parts of the subsurface.
Validation
Modern data has been collected from a number of different ocean margins where slope sedimentation is characterized by active deposition of sand on the upper and lower slope, and on the basin floor. Each of these systems has a range of different sea floor architectural elements. These examples and other scenarios, once recognized in the subsurface, can be compared directly with the modern data. Reservoir facies can then be calibrated to the seismic attributes in a narrowed-down series of scenarios.
The process is an iterative one, where modern, ancient and subsurface data are merged to validate models or reservoir facies distribution. As more modern data are collected in an integrated database, properly calibrated interpretations of high-quality 3D seismic data can continue apace, and give reservoir quality prediction exercises more weight.
Acknowledgements
Professor Michael Ivanov (UNESCO Centre for Marine Geology and Geophysics, Moscow State University), and Dr Neil Kenyon (Southampton Oceanography Centre, U.K.) collaborated over the past 10 years in acquiring data from deep-marine clastic systems for use in reservoir prediction. ENI-Agip is supporting BC's lectureship at the University of Aberdeen.
References
A complete list of references is available from the authors. Contact Dr. Bryan T Cronin at Tel: +44-(0)1224-273450, Fax:+44-(0)1224-272785, or Email: [email protected].
