Potential fields and inverse modeling exploration
By Greg J. Jorgensen, Jerry L. Kisabeth, Partha S. Routh,Conoco Inc.
Petroleum exploration in the deepwater Gulf of Mexico mini-basin province presents numerous technical challenges. One particularly challenging problem involves determining the complex 3D geometries of the salt bodies. While seismic data is the dominant exploration tool used to address this problem, there are ample instances where imaging the base and/or the top of the salt formations has proven elusive. These salt formations produce significant gravity and magnetic field variations. Conoco uses gravity, magnetic, and gravity tensor measurements along with 3D inverse modeling methods to routinely map these formations in exploration effort from the prospect scale to the entire mini-basin province scale.
Salt formations play a crucial role in several aspects of the total exploration effort and knowledge of their geometries assists. These include:
• Understanding salt genesis
• Mapping sedimentation fairways
• Delineating hydrocarbon migration pathways
• Predicting trap formation
• determining reservoir extents and volumes
• Affecting sub-salt seismic imaging
• Formulating seismic migration velocity models
• Calculating overpressure conditions
• Generating prospects
• Evaluating equity positions.
Tensor gravity data
The objective of traditional gravity surveys is to measure variations in the anomalous component of gravity in the vertical direction (gz) due to density anomalies in the subsurface. However, this anomalous gravity due to geologic structures has components in all three directions (gx, gy, and gz). It should be noted that the gx and gy components cannot be measured by standard gravity surveys.
In tensor gravity surveys, this restriction can be circumvented by measuring the spatial changes of the anomalous gravity field simultaneously in all three directions. With three components, each capable of change in three directions, a total of nine possible tensor components exist. The physical properties of gravity fields are such that only five of the tensor components (Txx, Txy, Txz, Tyy, and Tyz) are necessary to completely define these fields. For example, Txx is the variation of the gx in the x direction, Tzy the variation of the gz in the y direction, etc.
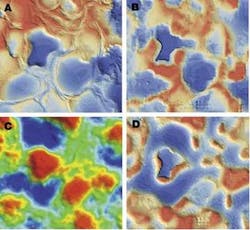
The use of gravity gradiometry for exploration purposes continues to grow. A key value of tensor data lies in its ability to achieve a high level of signal-to-noise ratio enhancement for each of the tensor channels and gravity channel. This enhancement is achieved by operating on all channels simultaneously using patented and patent-pending proprietary techniques developed at Conoco. The following images show the results of Conoco's proprietary tensor Laplacian processing method compared to a standard filtering approach. A noticeable improvement in signal coherency is observed in the Laplacian processing.
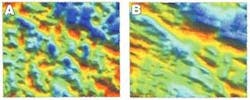
The tensor images and the interpretative images are from a shallow marine environment and demonstrate the resolution capabilities of gravity gradiometry technology. Conoco prefers to use the gravity gradiometry data in addition to the normal gravity and magnetic data to improve the resolution and accuracy of the inversion prediction.
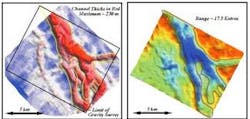
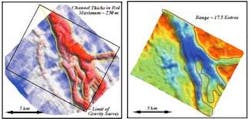
Gravity gradiometry data can also be acquired in higher sea states than normal gravity surveys. The images below show a seismically derived time thickness map over a channel sand system and the Tzz tensor fields. The tensor gravity data does an excellent job in defining the sand channel boundaries.
Inversion
The best way to fully leverage potential fields data for salt imaging purposes is to perform simultaneous 3D inverse modeling on all available data channels (gravity, gravity tensors, magnetics). Inversion is a remote sensing process that takes the surface-acquired data and maps it to 3D subsurface information.
Conoco has developed and patented robust 3D inversion methods that can simultaneously invert on gravity, magnetic, and gravity tensor fields, while accounting for lateral and vertical density, and magnetic susceptibility variations within the sediments. The input data to the inversion is the bathymetry, top of salt, density function, susceptibility function, gravity, gravity tensor, and magnetic fields. The end result includes base of salt prediction from the inversion and salt thickness information.
Imaging the nil zone
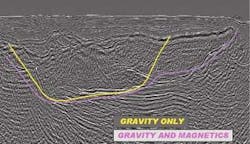
This first case study demonstrates the value of jointly inverting on both the gravity and magnetic fields, particularly when dealing with complications related to the nil zone. The nil zone is defined as that region wherein the salt and sediment densities are nearly identical. In these regions, salt masses produce insignificant gravitational signals.
A seismic image was chosen that shows both a top and base for the allochthonous salt unit. Shown on the seismic image are the results of a 3D gravity inversion and a joint 3D gravity and magnetics inversion. At depth, both the gravity and gravity/magnetic inversions map out the base of salt. As the base reflector shallows towards the right, the inversion of gravity alone fails to track the base-of-salt event, but the joint gravity and magnetic inversion results continue to provide good agreement with the seismic base of salt. Upon examination of density logs, it was determined that the shallower portion of the salt wing lies near and within the nil zone. As the nil zone does not affect the magnetic field, the joint inversion is able to provide an adequate solution. This also demonstrates how well the predicted base of salt from the inversion compares with the base of salt reflection from the seismic data.
Mapping salt roots
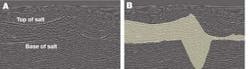
This next case study demonstrates the value that potential fields data and inverse modeling can have at the prospect level. The image shows a pre-stack migration seismic depth image 12 km in length. The top-of-salt event is evident across the entire image. The base of salt is also evident across most of the image except for a small gap approximately two miles in width directly below the large apex in the top-of-salt reflector. The exploration objective is the large, sub-salt anticline positioned below the gap in the base-of-salt reflection. The preferred and widely accepted seismic interpretation was an essentially flat base of salt across the entire line. It was reasoned that the gap in the base-of-salt reflection was due to energy dispersion related to the complex shape in the top-of-salt.
Another possible interpretation is that the gap is due to a thickened salt section having a root-like geometry extending downward toward, and potentially through, the sub-salt anticline. The correct interpretation would have a major impact on any drilling location. A thickened salt section extending deep enough to breach the primary reservoir horizon would heavily affect volumetric calculations.
A 3D joint gravity and magnetic inversion was run over the area, and the results are shown on the seismic image. In this problem, the base was partially constrained in regions having a good reflection event, thereby forcing the inversion to only operate in unconstrained areas. An excess salt mass is defined and extends down through the sub-salt anticline indicating a breached structure.
Subsequent drilling within the area confirmed the potential fields analysis. The extremely small incremental cost of using potential fields data, particularly in comparison to drilling costs, warrants their use in all exploration programs.
Salt mapping
This last case study demonstrates the results from applying potential fields data to map salt formations in map view. The images below show the bathymetry and top-of-salt surfaces for the study area. Gravity and gravity-tensor data covering the area were processed using the Conoco Laplacian approach previously discussed.
A 3D joint inversion was run to map the base of the salt body. In the base-of-salt image the blue colors indicate deep salt and the yellow to red colors show a shallower base-of-salt interface. Examination of the base of salt reveals a great deal of information about salt root locations, basin flank salt overhang geometry, regions of thin salt, and potential mini-basin to mini-basin communication pathways, among other valuable geologic data. These results can be obtained at minimal cost in input data and processing time.
Conclusion
Potential fields data can play a vital role in the exploration in the deepwater province of the Gulf of Mexico. The comparatively minimal costs involved in data purchase and analysis weighted against the value of geologic insights that can be obtained, warrant the investment.
Full leveraging of these data types can best be achieved through simultaneous inverse modeling methods. Critical care must be taken in pre-processing the data in order to reduce data errors. Tensor gravity data provide valuable information for the entire potential field analysis process and are of particular value in helping to reduce the noise content in vector and tensor gravity measurements.
This article has concentrated on the prediction of base of salt by gravity and magnetic inversion methods in the deepwater Gulf of Mexico. This inversion technique can also be applied in other basins around the world, both offshore and onshore, where better definition of the salt geometry is needed. In addition, the technique has been applied to mapping top of basement in the North Sea with successful results.
Knowledge of the base of salt provided by the inversion method has improved Conoco's ability to highgrade prospects, reprocess seismic data, and drill better wells in the deepwater subsalt province of the Gulf of Mexico.
Acknowledgements
The authors thank Conoco management, parti-cularly Dr. Alan Huffman, Rex McKinley, Randy Thompson, and Glen Penfield for their assistance in publishing this paper. We are indebted to Fugro-LCT, Western Geophysical, and Bell Geospace for permission to show portions of their data.