Bob Van Nieuwenhuise
Manuel Perez
Mark Langer
Michael Feng
Paradigm
Properly interpreting site survey data prior to deploying an offshore oil rig always has been crucial to drilling exploration or production wells. Site surveys can use multibeam, side-scan sonar, magnetometer surveys, and sparker or chirp surveys, just to name a few common techniques.
Most of these data are interpreted in analog form to provide site engineers information they need (Fish & Carr, 1990). Over the last 20 years computers tremendously improved the ability of the site survey engineer/geophysicist to interpret and to present data in a useful digital display form. Rarely, however, are these data loaded into and integrated with modern 3D seismic data. Integrating these two unique datasets (high frequency: 22.5 KHz sparker and normal frequency: 8-125 Hz 3D seismic data), can more completely interpret shallow horizons. This integration enables a look at deeper features in the shallow portions of the normal frequency 3D seismic data, tied together with the shallow high-frequency features just below the water bottom (at the first 60 m or 197 ft, or so). This is crucial to detail gas chimney and over-pressured shallow ground water problems that cannot be defined clearly with a single seismic data set.
Geological hazard identification
Many innovative software tools improve the usefulness of 2D and 3D seismic data generally collected at 12-250 Hz. While these data are excellent for deep geological investigations, the low frequency data does not always provide the best resolution at the ocean bottom.
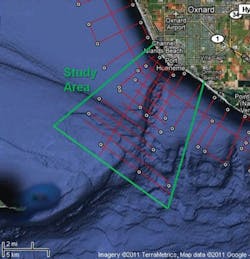
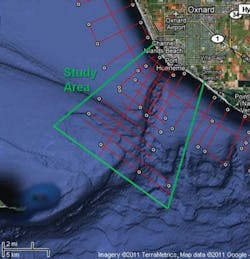
With the recent concern of geological hazards in deeper water, Paradigm decided to test its ability to process and display high frequency sparker seismic data using its seismic processing and interpretation tools. Paradigm’s Echos processing software, a component of the Rock and Fluid Canvas (RFC) 2009 synchronized software release, improves the S/N ratio of the mini-sparker data and the Paradigm SeisEarth interpretation displays those results. Public domain mini-sparker data were obtained from the USGS. The data were acquired in 2008 offshore Port Hueneme, California.
This dataset spans the Hueneme Submarine Canyon through which the sediments from the lower Santa Clara River flow into the Santa Monica basin. The data were acquired to determine the tsunamigenic potential of the sediments at the mouth of Hueneme Canyon. The Hueneme Canyon has nearly vertical outcrops composed of young sedimentary sequences. This indicates massive erosion during the latest Holocene. Because the canyon’s side-walls are over-steepened and contain unconsolidated deposits that accumulated rapidly, the potential for an earthquake-induced tsunami is high. The canyon is near the Los Angeles area so this risk associated with local faulting needs to be assessed (Normark, et. al., 2007).
Data acquisition
The USGS acquired these data using a SIG 2 Mille mini-sparker with a 500 joule high voltage electrical discharge to create a seismic source with more power and lower frequency than a typical chirp system (21 KHz). Depending on water depth, the source fired one to four times per second. At the survey speed of around 4 knots, data traces are created every ½ to 2 m (1.6 to 6.5 ft) along the ship track. These data were recorded every 62 μsec or 16 KHz using a 15-m (49-ft) long hydrophone streamer. The data processed had variable record lengths from 290 to 990 ms, depending on water depth. Differential GPS fixes were recorded in the SEG-Y trace headers in arc seconds. Data were recorded digitally in standard SEG-Y 32-bit floating point format using a Triton SBL system that merged the GPS and seismic data. For this study, the data are positioned using relative locations. The data were collected in profiles either parallel or perpendicular to the coastline on a roughly 1.2 km (0.75 mi) grid.
Data enhancement
Some fundamental processing was performed on the min-sparker data to appreciate its resolution of +/– 2 m (6.5 ft). This need is apparent when looking at the data before and after the processing to improve the S/N ratio. The noise trains seen initially make these data almost impossible to use in the SeisEarth 3D Canvas window. The simple processing performed using the Echos processing software followed this basic work flow:
- DSIN – Data load
- DBMUTE – Simple mute of the first arrivals of the water bottom
- FILTER – Band pass filter suppressing high bias seen as vertical line noise in the record
- AGC – Automatic gain control with a varying 200-440 ms window, depending on data length
- DBMUTE – Reinstate initial mute
- RUNMIX – 1-3-1 weighted boxcar filter
- FXDECON – FX domain Spectral Deconvolution using a 160 ms lag gap operator
- FKPOWER – FK sample power 1.1 over 200 ms to enhance the S/N ratio
- Final DBMUTE – Reinstate initial mute
- DSOUT – Output the final data set.
All the inherent noise and chatter typically recorded with mini-sparker data is reduced. These results show that these data were acquired extremely well and will be useful in a hazard survey.
Loading data
The processed mini-sparker seismic lines were loaded with a data sample rate of 62 μsec, rather than the typical 2 or 4 msec for 2D and 3D seismic data. Lines HC-12, HC-15, HC-17, and HC-20 are shown as the first three lines intersecting HC-12 in the shallow, steep slope and deepwater positions, thereby covering all expected scenarios. Note the line intersections with line HC-12. If we apply an opacity function to lines HC -15 and HC-17, and zoom in on the intersections, we see an excellent tie between those two lines with the ENE trending line HC-12. The three lines show intersection misties of less than 1 msec at the water bottom. This is why the 62 μsec data are used.
Lines HC-20, 17, and 15 (from left-to-right) Intersect line HC-12. The intersections noted with an arrow show no mistie in all three cases. Line HC-17 ranges from 0-740 msec.
Future work
A basic processing workflow on these data followed by loading into SeisEarth 3D Canvas enables a view of the 62 μsec data in a standard 3D seismic data package designed to view 2-4 msec data. The added advantage is to view both data sets together in 3D and effectively do hazard surveys using both types of seismic data.
Multiples in these data severely hampered the use of these types of data with depth. It is our intent to further design filtering and/or muting methods to remove these noise trains to further improve the data utility. One major problem in doing this with Chirp or mini-sparker data is that the data are not acquired as gathers. We simply acquire one trace per record. Therefore, no surface consistent methodology is possible (as there is no offset). Hence, the removal of multiples will require a more challenging data processing workflow.
Another item is the misties. Even though they were small (< 1 msec), these can be removed by loading the data at 62 μsec. In Echos, HEADER MATH can remove the misties line-by-line at any intersecting point.
In summary, 62 μsec data can be quickly and easily pre-processed and loaded into the SeisEarth 3D Canvas. This tool can co-render these data along with regular 8-250 Hz 2D and 3D seismic data.
References
Fish, John P. and H. Arnold Carr, 1990, Sound Underwater Images: A Guide to the interpretation of Side-scan sonar data, L. Cape Pub., Cataumut, p. 189.
Normark, W.R., D.J.W. Piper, and R. Sliter, 2006, Sea-level and tectonic control of middle to late Pleistocene turbidite systems in Santa Monica Basin, offshore California: Sedimentology, v. 53, p. 867-897.
Ray W. Sliter, Peter J. Triezenberg, Patrick E. Hart, Amy E. Draut, William R. Normark, and James E. Conrad, 2008, High-Resolution Chirp and Mini-Sparker Seismic-Reflection Data From the Southern California Continental Shelf — Gaviota to Mugu Canyon, USGS Open File Report 2008-1246, p. 4.
Offshore Articles Archives
View Oil and Gas Articles on PennEnergy.com
