The North Falkland basin: a new lease on life

The British Geological Survey (BGS) estimates that the North Falkland basin may be the second richest source rock in the world with, perhaps, as much as 100 Bbbl of oil, much of which is thought to be still trapped beneath the regional seal. In exploration terms, the Falkland Islands are remote -- lying in the southwest Atlantic Ocean at the nearest point 300 mi from Argentina. Despite the area’s reserves potential, only six wells have ever been drilled in the region.
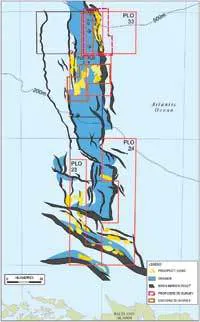
The North Falkland basin comprises two main structural elements: a north-south trending graben, and a set of subsidiary basins to the west and south of the graben which are controlled by a north-south trending extensional fault but constrained by northwest and southeast orientated reactivated Palaeozoic thrust sheets. The main North Falkland graben is about 50 km wide at its northern end and about 30 km wide near its southern margin, which is 36 km north of the Falkland Islands.
As presently mapped, the basin is 230 km long, but may extend further to the northeast. The basin contains a late Jurassic to early Cretaceous lacustrine source rock.
Shell, Amerada Hess, and Lasmo, in a coordinated campaign in 1998, drilled six wells, most of them within 38 km of each other in the northern half of the basin. The campaign proved the existence of at least two working hydrocarbon systems with five of the wells showing the presence of hydrocarbons. One well (14/10-1) actually flowed live oil to the surface from a deep sandstone reservoir at TD of 3,000 m. Another well flowed gas to the surface and also confirmed the existence of a second deeper source rock.
Following that campaign, Ben Hillier of Shell and Phil Richards of the BGS published a paper in which they described the lower cretaceous source rock drilled through in well 14/10-1 as the second richest in the world. In that paper, they estimate that cretaceous source rock could have expelled over 100 Bbbl of oil, much of which could still be trapped beneath the regional seal. The source is very thick at over 1,000 m with only the lower parts mature for hydrocarbon generation. The upper parts form a shale seal across the region. Wells drilled in 1998 targeted post rift prospects which could not be charged by the oil generated and expelled in the lower part of the source rock.
Unfortunately, in 1998, the oil price was heading downwards to $12 per barrel and oil companies were cutting exploration budgets. The North Falkland basin campaign suffered as a consequence. After that period, smaller explorers were the first to return.
UK-based Rockhopper Exploration Plc is one such company. It is the largest license-holder in the North Falkland, basin holding 100% of four offshore production licenses covering over 5,800 sq km. These include PL023 and PL024 located 25 km from the Islands in an undrilled part of the basin in water depths of less than 200 m. Further north, licenses PL032 and PL033 are in water depths of 350-500 m. These were held previously by Shell, who relinquished them in 2001. Two of the wells drilled in the 1998 campaign were on this acreage and both demonstrated the presence of hydrocarbons, one flowing live oil to the surface. Neither well was flow tested by Shell.
Rockhopper has reinterpreted the existing 2D seismic data and identified a number of prospects along the basin margin, including the Ernest prospect. All of them represent untested plays.
Active in North Falklands
Since raising funds and listing on the Alternative Investment Market of the London Stock Exchange in August 2005, Rockhopper has been taking steps to evaluate its extensive Falklands Island exploration acreage. Within licenses PL023 and PL024, Rockhopper has acquired 920 km of new 2D seismic as well as employing Offshore Hydrocarbon Mapping plc (OHM) to conduct Controlled Source ElectroMagnetic (CSEM) surveys over two specific targets. CSEM results were released in October 2006.
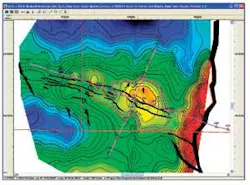
“The CSEM survey has provided great clarity over the Ernest prospect and is giving us what we consider to be a very strong hydrocarbon indicator within the 4-way structural closure,” says Sam Moody, Rockhopper MD. “The second survey has currently redirected our attention from what had been considered an interesting lead but is now less so, to an adjacent encouraging and interesting lead that warrants further examination.”
According to Rockhopper, the Ernest prospect is a relatively low-risk independent 4-way dip closed structure in 160 m of water only 100 km from the Islands, with an aerial extent of some 2,880 acres. Rockhopper also says it is possible to map a much bigger, somewhat more risky closure around it. This area depends upon closure against a major fault to the east and has an area of over 6,000 acres.
The CSEM surveying technique applied by OHM is used, often in combination with other geophysical remote sensing techniques, to provide meaningful images of the structure of the earth which can be used in the search for hydrocarbons. Rockhopper has changed the nature of exploration in the Islands with its use of CSEM, and now Falklands Oil and Gas is following their lead. The company plans to collect CSEM data later this winter in deepwater to the south and east of the Islands.
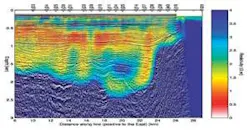
On both of the CSEM lines acquired over Ernest, a discreet resistive body has been observed within the bounds of the 4-way closure. That resistor, according to Rockhopper, when combined with the new seismic data, is suggestive of the presence of a hydrocarbon accumulation trapped within the structure that could contain 312 MMbbl of oil with around 100 MMbbl recoverable based on the smaller, 4-way dip closure only.
“Following the interpretation of the combined 2D and CSEM data, we have significantly de-risked prospect Ernest, with the main remaining risk being associated with reservoir,” said Sam Moody of Rockhopper. “The prospect is now ready to drill in terms of its seismic definition.”
Rockhopper and OHM scored two firsts during this campaign. This is the first time that CSEM has been applied in the Falkland Islands and the first time that a junior E&P company has used CSEM.
In addition to the CSEM results, Rockhopper says there are many more leads to consider following interpretation of 2D seismic data on licenses PL032 and PL033 where oil has already been proved in well 14/10-1. Rockhopper has embarked on a 685 sq km 3D seismic acquisition program with Compagnie Générale de Géophysique.
In addition to its four wholly owned licenses, Rockhopper signed a 2005 farm-in agreement with Desire, the operator of PL03 and PL04. Desire has sought a suitable drilling rig for some time. However, constantly increasing rig rates, the remote location of the Falkland Islands, and the relatively low number of wells planned in the basin so far (three), have made precluded contracting a rig. This delay in obtaining a rig could actually prove advantageous. Over the next year or so, with Ernest now drill-ready and Rockhopper looking to add more prospects to the drillable category by mid 2007, a coordinated drilling campaign is likely.
Controlled source electromagnetic imaging can reduce deepwater exploration risk
Lucy Macgregor, Ph.D. - Offshore Hydrocarbon Mapping Plc.
As the E&P industry continues its quest to discover untapped reserves, exploration and production companies increasingly turn their attention to relatively under explored acreage and deepwater tracts. With highly-challenging operating conditions in deep water, the complexity of drilling wells and their high costs running into tens of millions of dollars, reducing the risks of drilling prospects as efficiently and cost effectively as possible is vital to commercial success. As a result, upstream oil and gas companies look to new techniques such as Controlled Source Electromagnetic Imaging (CSEM) to improve the chances of drilling success. Offshore Hydrocarbon Mapping has seen use of CSEM grow rapidly over the last two years, with a range of upstream explorers commissioning CSEM.
Seismic surveying historically is the key tool to explore the subsurface for hydrocarbon reserves. In today’s competitive climate and with deepwater exploration so challenging and expensive, explorers no longer rely on seismic lines alone to choose drilling locations. Seismic surveying is instrumental in mapping the subsurface and works well in many contexts, particularly to identify structural traps. However, it gives little information about the nature of the fluids within these structures. In contrast, controlled source electromagnetic imaging is able, in many cases, to differentiate between hydrocarbon-bearing and water bearing geological formations.
What is CSEM?
CSEM identifies the difference in resistivity between water-saturated sediments and those containing hydrocarbons. The resistivity in hydrocarbon bearing layers is typically 10 - 100 times greater than that in the surrounding strata. This contrast can be used to detect and delineate structures likely to contain oil and gas.
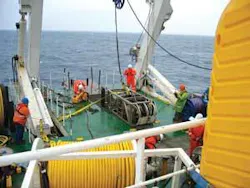
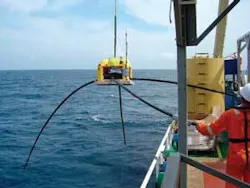
To map the variations in resistivity, CSEM uses electromagnetic signals. A high-powered electromagnetic source is towed through the water close to the seabed. The source transmits a low-frequency signal which is detected by receivers placed on the seabed. Each receiver detects and records the electromagnetic fields at the sea floor at offsets of up to 15 km. The variation of the received signal as the source is towed allows scientists to determine the resistivity of the subsurface geological formations.
Data interpretation requires application of complex algorithms, including forward modelling and inversion techniques, to turn the electromagnetic data into two-dimensional and three-dimensional images of the subsurface. The technique can map complex reservoir structures anywhere from a few meters to several kilometers depth.
Survey planning
The success of the technique not only relies on skillful interpretation of the electromagnetic data, but also on careful planning of the survey. Some geological conditions can prove challenging for the technology. For example formations such as carbonates or volcanics can display the same resistivity as hydrocarbons.
Pre-survey modeling is vital as it determines whether the expected response from the structure of interest is likely to be detectable. It also provides a means to determine the optimum placement of the electromagnetic receivers on the seabed. Each survey must be planned taking into account the survey objectives to ensure the optimum dataset is collected. Post-survey, Offshore Hydrocarbon Mapping takes care in the analysis and interpretation to arrive at a geo-electric section or volume, providing intuitive images the client can use in the exploration process.
The technique not only offers exploration companies the opportunity to distinguish between water-filled and hydrocarbon-bearing structures but can also map their location, indicating both presence and distribution. It also can provide valuable information about the level of gas saturation, overcoming a key pitfall of using seismic alone.
Deepwater exploration
With the cost of deepwater drilling, CSEM is particularly to reduce the risk in exploration. CSEM surveys can be undertaken as easily in deepwater as in shallower water. Positioning equipment takes slightly longer in deeper water, but there are no significant operational challenges posed to the technique by deepwater. Offshore Hydrocarbon Mapping has applied the technique effectively for clients over deepwater prospects in a range of geological environments. Multi-client surveys in West Africa and off Norway have been used to determine investments committed by oil and gas exploration companies in bid rounds.
CSEM also can be used in shallow water. Technical challenges posed by ‘airwave’ (the component of the received signal that has interacted with the atmosphere) interference swamping the response from below the seabed in shallower water had, until recently, limited its application to areas of ocean 300 m deep or more. However, OHM has developed ways of mitigating the ‘airwave’ effect, enabling the technique to be used in water depth as shallow as 50 m in some areas.
CSEM technology is not new: it has been developed over the last 25 years in the academic sector and has been used extensively by the geophysical community. Researchers have applied the method to examining the properties of fluid in the earth, initially over active hydrothermal and volcanic systems on mid-ocean ridges. Use by oil and gas exploration and production companies has grown steadily over recent years, with Offshore Hydrocarbon Mapping seeing increasing levels of enquiries. This year the company’s order book for surveys has reached higher levels than every before, highlighting the rise in the use of the technique by the oil and gas industry.
Although the technique currently is used largely in exploration and appraisal, future applications of the technology include reservoir monitoring and management applications.
About the author
Dr. Lucy Macgregor is chief scientific officer with Offshore Hydrocarbon Mapping Plc, based in Aberdeen, Scotland. She has over 10 years’ experience as a leading researcher in CSEM and its application to the detection and characterisation of fluids in the earth, and leads the company’s research and development group. Macgregor has extensive experience in the development and application of data processing, modeling and inversion technique, and has been responsible for survey design and data interpretation on commercial surveys in a variety of geological environments. Macgregor has a PhD from the University of Cambridge for research in the field of CSEMI and is a visiting fellow of Southampton University.