Empirical relations characterize rig day rates
Mark J. Kaiser
Brian F. Snyder
Center for Energy Studies
Louisiana State University
Rig demand and day rates are influenced by a number of market-driven and rig-specific factors and interact in a complex fashion depending upon spatial and temporal categorizations. The purpose of this article is to summarize key empirical results quantifying day rate relations in the world offshore rig markets between 2000 and 2010.
Oil price and utilization
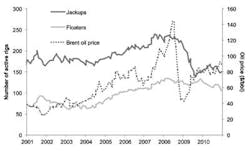
Oil prices are a widely recognized driver of activity in the upstream sector because drilling is the only way to increase supply and capture the economic benefit of high prices. As oil prices increase, the net income and capital budgets of E&P firms increase, and drilling activity responds. Increasing oil prices increase demand for drilling services which lead to increases in day rates, all other things being equal.
Source: Data from RigLogix, 2011; EIA 2011.
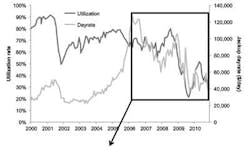
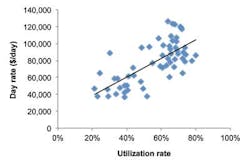
When regional utilization is low, the supply of stacked units is large relative to demand, and contractors bid aggressively to win work, increasing competition and lowering day rates. When utilization rates are high, there is more competition among E&P firms for access to drilling, and contractors can negotiate terms more favorable to them, increasing day rates and providing signals to the market that additional capacity can be absorbed.
Demand elasticity
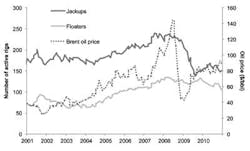
To estimate the elasticity of rig demand, we built regression models using the average monthly oil price and the 3, 6, 9, 12, 18 and 24-month moving average oil price as predictors of the total number of rigs under contract per month. All active rigs in all offshore basins were considered, and jackups and floaters were evaluated separately from 2000-10. Models were evaluated with and without logarithmic transformations, and the natural logarithm of the dependent and predictor variables provided the best fit models.
For jackups, the best model was given by:
| ln (Nt)=4.2+0.23 lnOil12 |
For floaters, the best model was given by:
| ln (Nt)=2.0+0.64 lnOil24 |
where Nt is the number of active rigs in month t and Oilk is the moving average oil price over the previous k months. Both models are first-order autoregressive and yieldhigh model fits (0.92, 0.97), and the coefficients were statistically significant (p < 0.05) and positive.
For jackups, the 12-month moving average oil price provides the best fit, and for floaters, the 24-month moving average is a better predictor than any shorter duration moving average, which suggests that rig activity responds slowly to changes in oil prices, consistent with the long lead times required for offshore drilling programs.
Source: Data from RigLogix, 2011.
The elasticity of rig activity suggests that for every 1% increase in the moving average of oil prices, the number of working rigs increases by less than 1%. Low elasticities are expected because offshore development is capital intensive and occurs over long development cycles, and E&P firms act conservatively and respond slowly to changes in market conditions. Since deepwater is associated with longer and more expensive development than shallow water regions, this same rationale at least partially explains why active floaters are correlated with a longer period of oil prices than jackups.
The trends remained the same when regions were considered separately, but the strength of the relationships declined for both rig classes, and in most cases, was no longer significant. This suggests that at the global level, oil prices are adequate predictors of demand, but at the regional level, local factors such as licensing, regulation, customer base, geologic prospectivity, gas prices, etc. play important roles. Oil prices are a global indicator of demand, and when oil prices rise global demand is stimulated, but the regional distribution of that demand is determined by local factors.
Day rates and oil prices
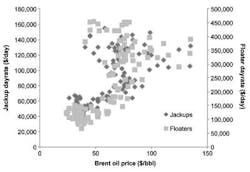
Global monthly jackup and floater day rates were correlated against Brent oil prices between 2000-2010. For both rig classes, a cluster of data at high day rates and $40-$80 oil prices arise, corresponding to the period following the oil price declines of mid-to-late 2008. During this period, day rates did not change as quickly as the commodity price fluctuations, and rapid shifts in the markets were not immediately reflected in day rates.
Autoregressive models were used to estimate price elasticity in jackup and floater day rates over the time period 2000-2010. Oil price and 3, 6, 9, 12, 18 and 24-month moving average oil prices were used as predictor variables.
For jackups, the best model was second-order autoregressive:
| ln (DRt)=7.8+0.87 lnOil12 |
For floaters, the best model was first-order autoregressive:
| ln (DRt)=6.8+1.4 lnOil24 |
where DRt is the average day rate in month t and Oilk is the moving average oil price over the previous k months. Both models yielded high best-fits (0.91, 0.93).
Day rates are positively related to oil prices and the model coefficients are positive regardless of the length of the moving average employed. The 12-month moving average oil price was the best predictor for jackup day rates and the 24-month moving average was the best predictor of floater day rates. Jackup day rates respond rapidly to changes in oil price because of shorter drilling campaigns and the integrative effects of the moving average.
Day rate elasticity was 0.87 for jackups and 1.4 for floaters, but the rig class elasticities should not be directly compared because oil prices in the floater model are averaged over a longer period and tend to be more stable; e.g., a 1% increase in the 24-month moving average signifies a greater shift in market conditions than a 1% increase in the 12-month moving average.
Model coefficients were similar when regions were compared separately. For jackups, elasticities varied from 0.7 in the Persian Gulf to 0.95 in the GoM. For floaters, regional elasticities varied from 1.0 (West Africa) to 1.2 (Southeast Asia). Therefore, while oil prices are not a good predictor of regional demand, they are an adequate predictor of day rates at the regional level, and reflect the fact that day rates are more strongly correlated between regions than the number of active rigs.
Day rates and utilization
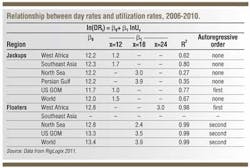
Day rates and the 3, 6, 9, 12, 18, and 24- month moving average utilization rates were regressed across five regional jackup markets and four floater markets in the 2006-10 period using the functional specification:
| ln(DRt) = β0+ β1 ln(Ux) |
where DRt is the average day rate in month t and Ux is the x-month moving average of the utilization rate.
Source: Data from RigLogix, 2011.
In most cases, statistically significant models were constructed. However, the North Sea and Persian Gulf jackup models only explained a small proportion of the variation in day rates, and no statistically meaningful relationship in the Southeast Asian floater market could be found. All successful models contained a 12, 18 or 24-month moving average predictor, and the moving averages in the jackup models were of shorter duration than those in the floater models.
Utilization and day rate relationships vary by region, rig class, and time period. The Persian Gulf and North Sea had the lowest variance in utilization rates and the models were not sensitive enough to explain most of this variation. One factor utilization-based models were adequate for explaining large changes in day rates but were unable to resolve more subtle differences.
No significant relationship between utilization and day rates was detected in the Southeast Asian floater market. The Southeast Asian floater market is significantly smaller and utilization consistently lower than other floater markets, and over 2006-10, utilization in the region did not follow the broader markets, due in part to its close proximity to Indian, Chinese, and Australian floater markets, and the highly mobile nature of the units.
No significant relationships were found over the 2000-10 period, suggesting that the utility of utilization rates to predict day rates is time-dependent, and over the longer term, other factors (e.g. oil prices, newbuild deliveries) are likely to impact evaluation.
Day rates and rig specification
Differences in rig specification lead to product differentiation in the market. A number of rig specifications exist, but water depth and drilling depth are the most critical in determining the capability of a rig to drill a well. As water depth and target formation depth increases, the number of rigs capable of performing the operation declines, reducing competition and increasing prices. For wells drilled in shallow water or targeting shallow formations, more advanced capabilities are usually not necessary.
Drilling depth
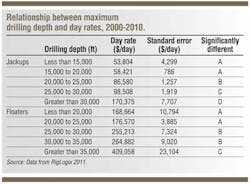
Day rates increase with increasing drilling depth capability across both rig classes. For jackups, rigs with drilling depth capabilities < 15,000 ft did not have significantly different day rates from rigs with maximum drilling depths of 15-25,000 ft, but all other drilling depth categories were significantly different.
For floaters, rigs with capabilities < 20,000 ft charged day rates that were indistinguishable from those with capabilities of 20-25,000 ft; and rigs with capabilities of 25-30,000 ft were indistinguishable from rigs with 30-35,000 ft drilling capacities. Rigs with drilling capabilities < 25,000 ft, 25-35,000 ft and > 35,000 ft were significantly different and the direction of the differences matched expectations.
Water depth
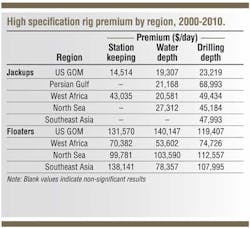
In both rig classes, deeper water depth capabilities are associated with day rate premiums. For jackups, the premium is largest ($30,000/day) between the 300-350 ft and 350-400 ft water depth categories. There was no significant difference between the 350-400 and > 400 ft jackup categories.
For floaters, all four water depth categories are significantly different, but the biggest difference arises between the 5,000-7,500 ft and > 7,500 ft categories. In this case, the premium is $80,000/day, while the premium among the other water depth categories is $23,000 to $34,000/day.
Station keeping
Dynamically positioned floaters are more expensive than moored floaters; independent leg cantilever jackups are more expensive than mat or slot units, and both differences are statistically significant across each of the regional markets examined. Contractors charge a premium of $113,000/day for DP floaters and $35,000/day for independent leg-cantilever units. The value of this premium over a 20-year operational life assuming 75% utilization and a 10% discount rate is $260 million for floaters and $80 million for jackups.
Regional control
All regions experienced higher day rates for deepwater jackups except Southeast Asia. The significant price difference between jackups with water depth capabilities less than and greater than 300 ft in the Persian Gulf was unexpected because operators cannot use the increased water depth capacity of these rigs but still pay a premium for this capacity. The vast majority of the Persian Gulf is less than 300 ft deep and it is unlikely that rigs with water depth capability > 300 ft are required for drilling operations. The result is higher well construction cost and economic inefficiencies.
Drilling depth was associated with increased day rates in all regions, but the size of the premium varied significantly among jackup markets, from approximately $20,000/day in the GoM to nearly $70,000/day in the Persian Gulf. Low premiums in the GoM are due to low day rates, while the price premium in the Persian Gulf is associated with the temporal distribution of high and low-specification rig utilizations.
For floaters, high-spec rigs enjoyed a significant day rate premium over low-spec rigs in every region and every specification category. The premium in West Africa was always smaller than the premium in any other region.
Editor's note: This article is the second part of a three-part series by Mark Kaiser and Brian Snyder on the factors that impact offshore rig day rates.
