Interpreting sonic logs for seismic may resolve reservoir detection problems
By Jonathan Bork
Apache Corp.
Attributing rock property significance to seismic data has always been a key objective in the exploration industry, and never more so than with current demands to extract detailed reservoir descriptions. Whether the application is identification of a deepwater play where a great deal of money is at stake or extraction of the last drop of hydrocarbons from a mature field, methods to produce the required detail must involve some kind of interpretation of the correspondence between the seismic lobes (or an attribute of a lobe) and the seismic rock properties measured in a borehole.
The industry has recently seen an increase in seismic inversion techniques, especially pre-stack inversion methods. These attempt to estimate seismic rock properties such as P-wave or S-wave velocity or impedance directly from the seismic data. However, successful inversion applications require calibration to borehole measurements so that inverted results scale directly to rock properties.
Even more widespread are the varieties of seismic-to-rock property tasks required of interpreters. These may range from the process of specifying the lobe corresponding to a desired mapping horizon to the more complex job of developing a complex geologic interpretation, including spatial facies, distributions, and fluid characteristics from a 2D or 3D seismic amplitude package.
In every interpretation job, a correspondence between the seismic data and the seismic rock properties is attempted or implied. Achieving this is often far from trivial. Apart from data quality issues, the main reasons for the difficulty lie in the wide disparity between the two data types.
We usually observe thousands, if not tens of thousands, of rock property variations capable of influencing the seismic. Many variations are very rapid changes or jumps because the log data is acquired as point measurements, for example, independent of its neighbors. Seismic traces, on the other hand, are represented by a few score or perhaps a few hundred events or lobes and are interdependent on nearby reflection coefficients. Clearly, some information is lost in the process of obtaining interpretable seismic data, leading us to ask:
- What borehole information is lost and what does this information look like?
- If the seismic does not see all of the borehole data, then just what part of the original logs does the seismic respond to?
Data character
Seismic data has a smooth oscillatory character, while log data is distinctly layered. It is this layered quality of borehole data that makes it easy to interpret by geologic layers. A feature of this importance should not be sacrificed in any attempt to process logs in order to make them more readily comparable to the seismic. Matching logs and seismic was attempted in the past by band-pass filtering the logs, but with methods of this type, the top and base of layers are no longer distinct. Moreover, filtering artifacts are introduced making the correspondence between the two even more arbitrary.
The differences outlined in the table explain the bulk of our difficulty relating seismic data to log data in the noise-free case. To restate, first there is an inability on the part of the seismic method to "see" or respond equally to all of the log data, causing confusion as to what part of the original log is important. Second, there is the compression of many jump discontinuities in the logs into far fewer (and smoother) seismic events.
We need a method that strips the log of information that is not visible to the seismic method while retaining its essential layered character. This is a simpler log and one that enhances the seismic-to-log correspondence.
Seismic resolution
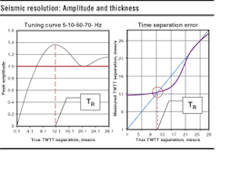
The method is based on the seismic resolution concepts of Kallweit and Wood (1982, Geophysics). We are concerned with one case they discussed: two reflection coefficients of equal magnitude but opposite sign (called a dipole) were allowed to vary in time separation. Kallweit and Wood developed curves from this relation- ship.
The curve on the left, the so-called 'tuning curve,' describes the constructive and destructive interference between the two waveforms associated with the two reflection coefficients. As the bed thins, the tuning curve reaches a maximum, called temporal resolution, TR, and then plunges uniformly toward zero.
The tuning curve is an elegant description of the total interference between two waveforms slightly separated in time. If we restrict our attention to that portion of the tuning curve below TR, we can further subdivide the curve into that portion where the values are above one and that part of the curve where the values are less than one.
When the tuning curve is greater than one, the maximum amplitude of the composite reflection exhibits false amplification. Conversely, for separations where the maximum value is less than one, the seismic once again does not reveal the true reflection coefficient value, but in this case information is lost. The tuning curve changes shape depending on the wavelet bandwidth. The temporal resolution value increases as bandwidth decreases.
Seismic detection
The tuning curve deals with the concept of seismic detection because eventually, for the thin bed case, the reflection events at the top and bottom of a thin bed become undetectable. The second curve on the right is concerned with our ability to accurately measure the temporal thickness of a bed by measuring the travel time between its two largest events. This curve is concerned with seismic resolution and it shows the travel time error introduced by the interaction of the layer geometry (thickness) and the seismic wavelet.
Seismic resolution concepts have been with us since the early eighties and have served us well especially as a conceptual framework to understand exploration scenarios, but there is a need to extend these concepts to more realistic problems. We need to extend resolution theory to multiple layers and unequal reflection coefficients. The tuning curve offers us the kernel of a transform for such a technique.
The method
The method scans the reflection coefficient series of the logs (normally density, velocity, or acoustic impedance) looking for dipoles with an ever-increasing time separation. Normally the dipoles found are not perfect (the two reflection coefficient pairs have unequal magnitudes).
By simply defining the smaller of the two magnitudes as constituting a perfect dipole, we remove it from the reflection coefficient series, multiply it by its corresponding tuning curve value, and place it in its identical location in a new, output reflection coefficient series. The residual reflection coefficient from the larger of the two spikes remains in the original series and is available for future scans as the time separation increases.
This process continues until the time separation increases to TR and the "dipole decomposition" is complete. The few remaining isolated reflection coefficients are added unscaled to the new reflection coefficient series. Lastly the entire reflection coefficient series is integrated and converted back to log form. This output is called the seismic detection log (SDL). The vast majority of reflection coefficients in a given series can be decomposed into a sum of dipoles. The SDL is usually simpler than the original log.
Equivalence
The seismic trace is the convolution of the seismic wavelet with the reflection coefficient series. We may convolve the wavelet with each of the individual dipoles in any order we wish and sum them (along with the resulting individual isolated wavelets) to produce the identical trace.
This is possible because the superposition principle allows us to convolve the wavelet with the reflection coefficients in any desired order as long as they are ultimately summed in their correct temporal locations. Since each dipole waveform is scaled according to its position on the tuning curve, if we simply do the same to the dipole itself, we arrive at the reflectivity version of the SDL. In other words, each dipole in the reflectivity is scaled exactly as its counterpart - the dipole wavelet.
This leads to an important conclusion: the SDL and the seismic trace are essentially equivalent functions. They are equivalent data in separate domains - the time domain (seismic trace) and the depth domain (SDL). This is analogous to the equivalence of time and frequency domain representations of the same function familiar to us from Fourier theory.
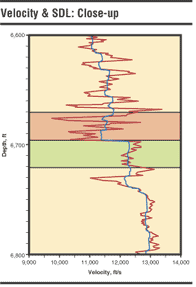
This in turn leads us to conclude that the rock property jumps and relative scalings on the SDL directly correspond to their impact on the seismic data. We may see, for example, that we can detect the base of a reservoir interval while its top is transparent. Difficult seismic problems such as the detectability of an entire zone can be interpreted directly on the SDL. This can be important information for the interpreter struggling with the lateral and vertical ambiguities of a complex reservoir interval.
Examples
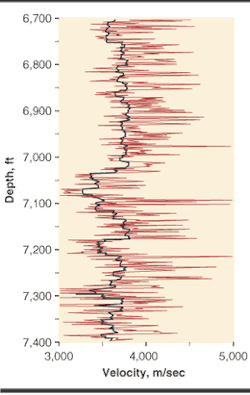
In the second figure we display the velocity log (red) for a well with the SDL overlain (black). The erratic swings in the velocity log would leave any interpreter confused. Which of these jump variations are important and which are not? The black SDL shows their relative importance.
A common approach to simplifying a log is to block it. The SDL has the appearance of a blocked log because many of the jumps have been significantly reduced. Although not a blocked log, the SDL could be used as a guide to selecting the boundaries for subsequent blocking. Note how the layered quality of the log has been maintained. We can still easily interpret important geologic layers, but now the log data has been scaled by the seismic method
The ability of dipole decomposition to unscramble the intricate interplay among rock property contrasts, layer geometry, and the seismic wavelet allows us to study entire zones. We are now able to solve the complex detection problem: where an interval consisting of multiple thin layers with reflection coefficients of different magnitudes and signs, and perhaps even transitional boundaries, can be quantitatively analyzed.
The SDL technique passes gradients. We can make quantitative judgments on the impact of the rock properties on the seismic data and conversely relate seismic events to their rock property counterparts.
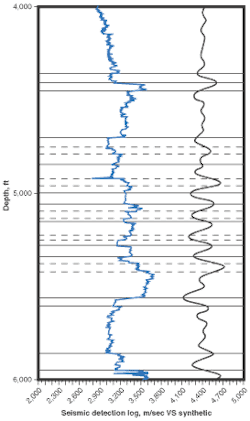
The last figure shows a synthetic seismogram and the corresponding SDL. The horizontal lines show the relationship between jumps in the rock property log and the peaks and troughs of the seismic trace. In some cases, two jumps contribute to the seismic lobe (shown by dashed lines) but there is an excellent relationship. Although excellent, the relationship is not perfect because the time shift error (function on the right in first figure) remains in the seismic.
Conclusions
Seismic rock property logs (i.e. sonic, density, or shear velocity) can be processed so that their essential
Dipole decomposition, the central part of the SDL algorithm, is able to unravel very complex reflectivity functions because dipoles represent most of the reflectivity function. We have extended seismic resolution concepts to complex logs. Consequently, the complex reservoir detection problem has been solved.
The interpretation conclusions follow because the seismic trace and the SDL are essentially equivalent, but exist in different domains. Therefore, we can interpret directly on the SDL.


