RESERVOIR MONITORING: Through-tubing pulsed neutron reservoir management solution in Asia-Pacific wells

Recent high oil prices and frequent supply shortages have led oil companies to maximize production from existing fields, rather than undertaking costly exploration projects in which there is no certainty of developing a return. Two means of accomplishing this are identification of bypassed pay intervals and management of production improvements through the use of reservoir monitoring techniques.
In many places, including the Asia-Pacific region, operators are using water and natural gas injection technology to increase production. Knowledge of flood propagation through the reservoir is critical to the bottom-line economic aspect of these projects. A comprehensive program of reservoir monitoring logs is essential to obtaining knowledge needed to manage and maximize production.
Pulsed neutron capture logs (PNC) work best in formations of known, high water salinity. But, in most water floods, the agent is fresh water or seawater, which can resemble oil to a PNC tool. When these fluids are flooded into formations that had contained water of known salinity, the salinity of the formation water is changed and the use of PNC logs is no longer feasible to determine remaining oil saturation.
Today, the recognized technology for the evaluation of reservoirs containing fresh water or water of unknown salinity is the carbon-oxygen (C/O) log. First developed in the early 1970s, carbon-oxygen tools use gamma-ray spectroscopy measurements to directly sense the presence of carbon atoms in oil and oxygen atoms in water. The ratio of counts in the carbon and oxygen windows is used to evaluate water and oil saturations, independent of formation water salinity.
Measurement improvement
Historically, the C/O log experienced limited use due to the primitive quality of measurements. To achieve the high-level answers required by operators, service companies built C/O tools with large-diameter detectors. Significant improvements were realized, but stationary measurements or excessively slow logging speeds were required, and the tools could only be conveyed into wells after removal of tubing.
Over the past several years, technical advances employing the latest, most modern detector and electronic technology have become available. In turn, this has yielded several small-diameter tools capable of logging through or below production tubing. However, the capability to pass through tubing often has resulted in some sacrifices in accuracy and logging speed, compared to larger diameter tools.
The following discusses the first results and experiences with a new through-tubing C/O tool, such as the tool's ability to handle extreme borehole and formation conditions that were encountered in the first Asia-Pacific wells logged during its commercial introduction. The new tool features a set of measurements that is comparable or better than earlier vintage, larger-diameter, C/O tools.
Tool description
The new tool, recently introduced by Halliburton, is the Reservoir Monitor Tool Elite, or RMT Elitetrademark system. The design is based on the need to have a through-tubing C/O tool with the accuracy of a larger device. With a diameter of 2 1/8-in., the tool permits passage through all common-tubing sizes above 2 3/8-in.
The choice of this tool size, rather than the traditional through-tubing diameter of 1 11/16-in. allows larger-diameter detectors to be used in the tool, which can lead to higher count rates of the characteristic high-energy gamma rays from carbon and oxygen.
A pair of bismuth germanate (BGO) crystals, 1.4 in. in diameter, are packaged within a Dewar flask, permitting use of lab-grade photo-multiplier tubes. The near-spaced crystal is 1 in. long and the far-spaced crystal is 6 in. long. The detectors, tubes, and an updated electronics section are combined to yield a tool exhibiting spectral resolution equivalent to large-diameter tools, in a package with total make-up length of 27 ft.
The modular design allows for combination with production log tool (PLT) sensors, which forms a tool string less than 50 ft in length, depending on the number and types of sensors deployed. The tool has two basic operating modes:
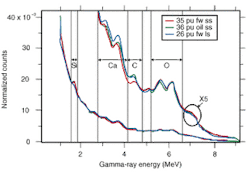
(1) Inelastic or C/O mode: In this mode, the neutron generator is turned on for 20 microseconds, at 100-microsecond intervals. After 200 neutron bursts (20 milliseconds), there is a 5-millisecond pause to measure background. This cyclic pattern is repeated continuously. Gamma-ray pulse-height spectra are obtained from each detector in three time gates (neutrons on, neutrons off, background) to provide inelastic scattering gamma ray events, capture gamma ray activity, and delayed activation and background activity. In this mode, the tool is capable of simultaneous measurements of carbon, oxygen, calcium, and silicon inelastic yields, formation capture cross section (A), oxygen activation for water flow detection, ratios for porosity estimation, and elemental capture yields.
(2) The second mode of operation replicates the pulsing and gating sequence of the thermal Multigate Decay-Lithogy (TMD-Ltrademark) PNC log, which is optimized for the A measurement. A slower pulse rate, optimized for thermal capture measurements, is interlaced every 20 ms, with a 5-ms pause to measure background. As in the inelastic mode, the three spectral measurements are recorded for each detector. This mode provides all the measurements normally associated with a PNC log, but with more efficient detection of high-energy capture gamma rays, leading to excellent lithologic analysis. The nominal logging speed for this mode is 20 ft/min., if spectral information is not essential, or 5 ft/min. to acquire high-quality spectral information.
Tool characterization
Response of the RMT Elite tool was characterized in known laboratory formations in the new tool response and characterization (TRAC) lab, which contains test pits that have a wide range of porosities, lithologies, formation fluids, and borehole sizes. Measurements in the pits were used in conjunction with established physics models of C/O tool responses to develop response algorithms.

The interpretation algorithms assume a standard set of borehole conditions consisting of a 10-in. diameter borehole with 7-in. casing filled with fresh water. When borehole conditions during logging are non-standard, environmental corrections are performed, based on additional TRAC lab measurements.
Several hundred test pit measurements were taken in the formations with a variety of casing and tubing sizes, cement thickness, borehole fluid types, and tubing placement within the borehole.
Field experience
The first commercial logs using the tool were recor-ded in Papua New Guinea in the Iagifu Hedinia Oil Field. Iagifu Hedinia was the first, and presently the largest, commercial oil find in Papua New Guinea. Located in the Papuan fold and thrust belt, it was discovered in 1986 by Chevron.
In 1998, a reservoir management team was assembled to address the field's production maximization. As part of this initiative, a logging campaign was started in June 2000 using the RMT Elite and production logging tools. The first logs were run to evaluate the Toro sands located in the Hedinia anticline structure.
A series of wells were selected for logging (indicated with the red circles on the map). The wells were selected as the best candidates for evaluating the present saturation conditions throughout the reservoir (black donut-shaped circles on the map accompanying this article indicate wells selected for logging; arrows identify the wells logged as well 'A' through well 'G').

The Toro formation consists of four members, the Toro A, Upper and Lower B, and C sands. Formation water salinity is roughly 12,000-PPM NaCl. There is an extensive hydraulic baffle system, due to the presence of siderite and calcite cement. Pressure in the formation is approximately 1,900 psi, which is very close to, if not at, the bubble point.
The wells were producing at a gas-oil ratio of 3,000 to 10,000. Governmental regulations limit the amount of gas that can be flared, with the remainder injected back into the formation. There were two explanations conceived for the high amounts of gas production:
- Development of a gas cap in the formation that was expanding down into the perforations.
- Injected gas was fingering through the higher permeability zones in the formations, with oil being left in the lesser permeability zones.
Field conditions
Due to gas injection and gas handling capacities, production was limited at times in some wells due to excessively high gas production. Because these were producing wells, each of the selected wells was scheduled to be logged while flowing and also shut-in. The logging program consisted of a number of tasks. The PLT sensor string consisted of fullbore spinner, temperature, pressure, fluid density, hydro tool, and gamma ray. Due to height limitations on the mast unit, logs were run separately.
The wells were not easy to log. The well sites were located on small mountainous peaks that typically can only be accessed via helicopter. All equipment used for logging had to be small enough to be packed for transportation by helicopter. Logging was performed using a portable mast unit, with no rig on the locations.
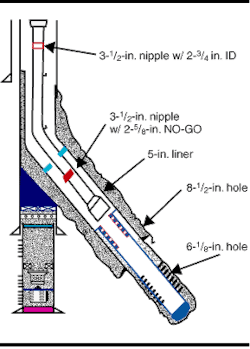
The variety of completions in the various producing wells posed an exceedingly difficult challenge for C/O logging. Most wells had been directionally drilled and many were dual completions. Packers separated completed zones with production regulated through the tubing by means of sliding sleeves.
Complex wellbore geometries and fluid columns are among the most difficult challenges to overcome in C/O log interpretation. Seven different conditions were encountered in one wellbore, involving three components (oil, water, and gas) and a piece of tubing tailpipe.
The reservoir contained large amounts of three varieties of gases in various combinations: injection gas, free gas, and solution gas. Due to the total amounts of gas in the formation, the standard two-phase saturation equation was not adequate. To correctly calculate oil saturations, the new PapuaSattrademark interpretation technique was developed, which uses a combination of A and C/O logs to accurately calculate oil and gas saturations. Similar techniques had previously been developed for steam flood reservoirs.
Summary
The RMT Elite system was able to make important assessments of the reservoir conditions, which resulted in recommendations for 14 workovers and the drilling of two new horizontal wells. An interpretation method, tailored to the local conditions, was able to define the reservoir conditions.
Use of these techniques can assist in development of a robust and optimized reservoir management plan. The introduction experiences with the tool demonstrated a number of capabilities:
- It obtained useful data in a wide variety of wellbore and environmental conditions, including logs measured through both tubing and casing.
- It was able to obtain valid log data in low porosity formations (porosities of 8-15%).
- Due to the large-detector design, it was possible to acquire high-quality log measurements at greater logging speeds than previous through-tubing C/O systems.
- Data obtained under producing wellbore conditions can be transformed to a standard set of conditions and then interpreted successfully.
Based on experiences gained during introduction of the tool, several best practice procedures have been adopted as common operating procedures. They are:
(1) At least one fluid identification device should be run in combination with the tool in producing wells.
(2) On flowing wells, it is best to run PLT sensors in combination with the RMT Elite system if operating conditions permit.
(3) It is advised to make the fewest number of passes in C/O mode at the slowest possible speed. Make at least two complete passes over the logged interval to verify tool repeatability.
Acknowledgement
Gary Younse and Ahmed Badruzzaman (Chevron) provided feedback and advice. The logging crews and log analysts undertook the project under trying conditions. Jack Howard made it possible to complete this paper.
Editor's Note: This is a summarized version of SPE 68713 paper presented at the SPE Asia Pacific Oil and Gas Conference and Exhibition held in Jakarta, Indonesia, April 17-19, 2001.