SUBSEA PRODUCTION: Combining fiber-optic holdup sensors with production logging sensors
For reservoir surveillance and field management purposes, consistent and reliable measurements of the total flow profile and holdup for both producing and injection wells across a field are critical. This information is routinely used to determine relative vertical and area distribution of production and injection for wells in the fields.
In multi-layered reservoir systems under active waterflood, well flow profiles, zonal productivities, and zonal oil/water split are needed to allocate fluid production/injection rates to flow units. This dynamic data can then be compared with other geological and petrophysical information.
Production log data can also be incorporated into reservoir simulation studies, particularly with respect to "reality-checking" the results from reservoir simulation models and scenarios. Zonal productivities and zonal oil/water split are also essential for identifying changes or diagnosing problems in well productivity and identifying candidates for production optimization by well interventions. In subsea wells, the cost of interventions is very high, so reservoir surveillance data needs to be of high quality with a minimum of uncertainty.
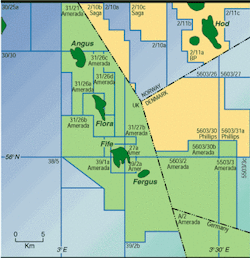
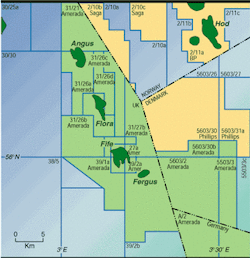
In the Fife and Hudson fields, located in the North Sea, production wells in two-phase (oil-water) flow are mostly completed with 5-in. production tubing and have surface flow rates ranging from 15,000 b/d (standard) to 35,000 b/d. This means the downhole conditions comprise of high-velocity and multiphase flow.
Critical measurements
Obtaining reliable flow profile and zonal phase splits in this wellbore environment is critical for effective reservoir management and to plan successful workover operations. For flow diagnosis and hold-up determination in such wells, conventional production logging measurements made with density devices such as the gradiomanometer or the nuclear fluid density device have limitations and uncertainties.
It is well known that frictional, jetting, and centering effects in high-velocity flow influence the gradiomanometer, and that the corrections to compensate for these factors start to be significant. Nuclear fluid density devices do have some sampling, statistical, and safety issues. Additionally, the reservoir formation response and the presence of wellbore scale can affect the accuracy of nuclear density measurements.
Electrical local hold-up probes also loose accuracy at high flow rates, when water or hydrocarbon bubble sizes become too small to be resolved correctly by the hold-up probes. To address these issues and to obtain reliable multiphase flow profiles, a hold-up sensor based on optical principles has been applied. This sensor was recently introduced to measure gas hold-up in liquid/gas environments. The application of this sensor to determine oil-water hold-up in high flow velocity wells is an extension of the tool's initial design capabilities and has not been tested.
Fife and Hudson
Logs from wells in the Fife and Hudson fields that have been surveyed using fiber-optic holdup sensors and conventional production logging sensors have been reviewed. Flowing and shut-in passes were acquired to determine zonal contributions and water cut. Also reviewed was the stabilized flow profile data comparing various sensors. Because rate changes were also made during the logging surveys, stationary measurements of transient pressure and rate were recorded. This data has potential to provide skin factors and reservoir parameters for individual zones in a layered reservoir system.
Production logging and saturation monitoring are used in Fife and Hudson fields to monitor reservoir performance, quantify fluid changes during production and injection, and identify unswept zones. They are a key element in the development and reservoir management of both fields.
Many of the wells are monobore completions with 5-in. production tubing. Surface flow rates are generally in the range 15,000-35,000 b/d. Some of the wells also produce at a high water-cut, so the downhole environment is multiphase flow with high fluid flow velocities. All the wells are producing above the bubble-point pressure. This type of wellbore environment and flow regime presented significant challenges for reliable flow diagnosis, and prompted the search for alternative sensors.
Flow diagnosis
Production logging in multiphase flow presents two main challenges in measurement of the flow stream properties: the non-uniform phase distribution within the wellbore and its temporal variation at any location in the wellbore. In multiphase flow, the pressure drop, phase holdup, and flow regimes are all interrelated.
Flow regimes have been classified into several categories and on this basis, a series of correlations and flow models have been developed. Certain types of production logging tools measure local and individual phase holdups.
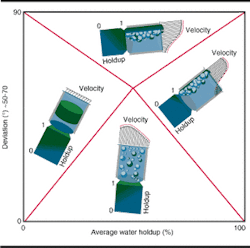
Some parameters that affect the flow regime are total flow rate, well internal diameter, and the physical properties of each fluid phase. Small changes in wellbore internal diameter can increase fluid velocity, and changes in well deviation can change in the flow regime and on the production logging sensor response. In deviated wells, the velocity profile and holdup distribution is complicated since the density contrast between fluids causes gravity segregation.
This results in a higher concentration of the light phase on the highside of the wellbore - unless the flow velocity is high enough to ensure mixing. A few degrees of deviation can also make large changes in flow regime. Wells with quite high total rates result in a downhole flow regime that mostly fall within the "bubble flow regime."
In multiphase flow environments, a sensor that measures the in-situ fraction of the wellbore occupied by each phase is needed. In the past, three types of measurements have been commonly used for this purpose: fluid-density, fluid electrical capacitance, and fluid conductivity.
Optical sensing
More recently, a new production logging tool has been developed which uses four optical probes deployed 90° apart on the arms of a centralizer to measure the optical reflectance of the surrounding fluid. The Gas Holdup Optical Sensing Tool (GHOST), like its electrical-probe analogue, has evenly spaced probes and their orientation in space is known through an integrated relative bearing measurement. Simi-larly, a holdup and bubble count image along the well is generated per logging pass during data acquisition. The tool is designed to detect gas holdup in gas-liquid mixtures, and it identifies gas entries in oil/water producers or water/ oil/condensate in gas wells.
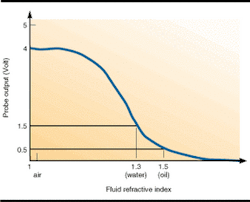
This particular tool represents the first application of optical sensing technology for the quantification of phase holdup in wells. Light emitted from an LED travels along an optical fiber and arrives on a sapphire needle. When the light reaches the tip of the probe, some is reflected from the tip/medium interface and through a coupler to a photo-diode that converts the reflected optical power into an electrical signal. The amount of reflection at the probe tip mainly depends upon the refractive index of the phase present. Note that the contrast between gas and liquid is significant, whereas oil and water resp-onses are close to each other. Focus will be directed in this small difference in the refractive index between oil and water.
All wells were surveyed with a prod-uction services platform (PSP) system that had the pressure, temperature and gradiomanometer sensors, two spinners (inline and fullbore), electrical holdup probes and optical holdup probes. The general test procedure was to monitor the surface production rates with a test separator, measure the flowing gradients, and perform a set of flowing pressures for each stabilized rate.
Stationary measurements of transient pressure and rate data between rate changes were recorded, and the operation ended with shut-in pressures and a pressure build-up survey.
Fife Well 1 observations
Fife Well 1, one of the subsea wells, has four perforated intervals. The well is deviated 57° across the reservoir section and has a casing of 4.276 in. nominal internal diameter. The well is a moderate-to-high flow rate well, producing oil and water with no free gas downhole.
During logging under stabilized flowing conditions, the downhole flow regime was mainly a water continuous mixture, with most of the liquid production and the main hydrocarbon entry, coming from the top perforation set (8,813-8,876 ft measured depth). The water cut during logging was about 80%, with a gross liquid rate of around 10,000 b/d. This operation shows that for the flow rates and wellbore conditions encountered during logging, the electrical probes and the optical probes gave consistent and comparable results.
Hudson Well 1 shutoff
Hudson Well 1 is a monobore, co-mingled, gas lifted, oil producer in the Rannoch and Etive Formation (Brent Group). It is a vertical well with three perforation sets, producing oil and water with no free gas at reservoir conditions. A production log was initially performed to determine the production profiles under flowing and shut-in conditions, to identify water entry points, and to check the gas lift valves.
Based on these results, a decision to set a casing patch was made. Due to the presence of a sand screen, the logging could not cover perforations in the Upper Broom Formation (6,575-6,605 ft MD). The production log survey indicated a water continuous mixture downhole and with trace amounts of water coming from the deeper Broom Formation perforations (6,575-6,605 ft MD).
The main water entry point was from 6,494-6,460 ft MD in the Etive Formation. In this survey, because of the high flow rate and fluid velocities (>750 ft/min), the gradiomanometer suffers from significant friction effects. For this reason, it has only been used in the interpretation below depths of 6,487 ft MD. The main holdup data was obtained from the optical sensors for intervals above 6,487 ft MD.
Post-water shutoff
Following the results of the first production log survey, a casing patch was set across the interval 6,460-6,507 ft MD for water shutoff. After the casing patch was set, another production log survey was performed in the well. The results indicate mainly an oil continuous mixture downhole. The main water entry point in the wellbore was right above the newly set patch. There was negligible water production from perforations in the deeper Broom Formation (6,575-6,605 ft MD).
Hudson Well 2
Hudson Well 2 is also a subsea well - a monobore, co-mingled, gas lifted, oil producer completed in the Rannoch and Etive Formation (Brent Group). The objective of this production logging survey was to determine the production profiles, to identify water entry points, and to check performance of the gas lift valves. Three perforation sets were open during the time of logging, although the presence of a sand screen meant that the toolstring could not log across the perforations in the Broom Formation (7,577-7,619 ft MD).
The results indicated that the main water entry starts at 7,520 ft MD, extending to 7,472 ft MD. Some water production was observed from the Upper Etive Formation along with the major oil entry after the casing patch. Combined production logging and transient testing in the Hudson field production logs are commonly run for measuring flow profiles and for well problem diagnosis. However, there is considerable value in combining these flow profiles with stationary measurements of transient pressure and rate during the rate changes that are often made in routine production log surveys.
Analysis of this type of data has potential to give well skin factors and reservoir parameters for all zones or for individual zones in a layered reservoir system. Measuring downhole flow rate and pressure enhances interpretation capabilities and allows transient tests during production logging surveys without shutting in a well.
Conclusions
Examining the performance of production logging sensors for determining oil-water holdup in high velocity two-phase flow demonstrated the feasibility of using fiber-optic holdup sensors. In all cases, the optical probes gave reliable and consistent holdup values that were used to interpret the acquired data set. Limitations of the other sensors were outlined, mainly the friction and jetting effects on the gradiomanometer, and very small bubbles for the electrical probes, resulting in misleading holdup values.
The field surveys showed the use of the acquired data for reservoir management decisions, which rely heavily on reliable water cut values per zone. For the particular cases presented, transient downhole data acquired with pressure and spinner also give valuable insight for reservoir and wellbore properties.
Acknowledgement
The authors would like to acknowledge the work of colleagues at the Amerada Hess Reservoir and Technical Services group in Aberdeen, and the Engineering group at the Schlumberger-Riboud Product Center in Paris. We also wish to express our gratitude to Amerada Hess Ltd. and its partners for allowing us to reproduce the data for the field examples used here. Amerada Hess's partners in the Fife field are Premier Pict Petroleum Ltd., and for the Hudson field the partners are Shell UK Ltd., Exxon Mobil International Ltd., Petrobras UK Ltd., CIECO Exploration and Production UK Ltd., and Lasmo (DMF) Ltd. Thanks also to Subodh Saxena, Schlumberger Field Service Manager and the Schlumberger Field Engineers - Edson Arakaki, Kevin Constable and Feraydoon Larizadeh who were involved in running the logs described here.
Editor's Note: This is a summarized version of the SPE 71727 paper that was prepared for presentation at the 2001 SPE Annual Technical Conference and Exhibition, held in New Orleans, Louisiana, Sept. 30 - Oct. 3 2001.


