Deep shelf drilling proves difficult and expensive
Gulf of Mexico operators await affordable technologies
James Dodson
Ted Dodson
James K. Dodson Co.
Victor Schmidt
Exploration Editor
Cost is the culprit, but the gang that goes with it is just as egre-gious: government regulations, environmental compliance, and delayed R&D development of advanced technologies. Add these barriers together, and quick development of the Gulf of Mexico deep shelf's potential is slowed to a crawl.
This is happening against a background of depleting domestic natural gas supply from older shallow shelf wells, reduced imports from Canada, and a rush to expand LNG import capability. To its credit, the US Minerals Management Service opened the deep shelf with royalty-free incentives, but those incentives are diminished by the rising price for natural gas (above $5/Mcf) and the challenges of deep shelf drilling. It all makes a deep shelf player pause and closely examine the economic equation. Deep shelf drilling is happening, but the reserves found thus far are not sufficient to arrest the general production decline. What is needed is a way to encourage more deep shelf drilling.
Why is it so difficult to get a deep well drilled? How can an operator gauge its drilling efficiency?
Deep drilling, below 15,000 ft TVD to meet MMS incentives, means that the well will encounter higher pressures and temperatures that are near or exceed the capability of most available drilling equipment. Ultradeep shelf wells below 20,000 ft (some planned to 30,000 ft) become more complex as mud pump pressure equals the hydrostatic pressure at the bit face in the over-pressured zone. Safety tolerances shrink and it is much easier for a driller to experience more problem days from high pressure-high temperature issues downhole.
Jackup rigs drilling most of the deep shelf wells, especially those below 20,000 ft, require higher hook loads, larger and stronger mud pumps, wider and sturdier decks, BOPs rated to 30,000 psi, extra tanks for specialized drilling fluids, and other equipment to extend the drilling ability of the jackup fleet. New rigs are on the way to meet these challenges.
In the meantime, existing rigs are drilling some of the less challenging deep wells. The analysis presented below focuses on jackups and their drilling performance described by the ROP/MRI index.
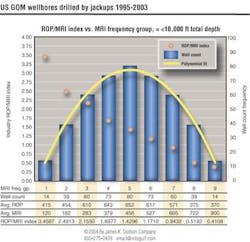
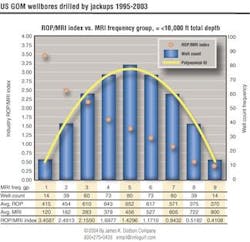
The ROP/MRI index versus MRI frequency for 452 wellbores (25% of 1,789 wellbores), drilled to =<10,000 ft TD from 1995-2003, shows the inverse relationship of ROP and MRI. The industry ROP/MRI index is plotted for each of the nine MRI frequency groups, which form a bell curve with an R2 correlation value of 0.9958.
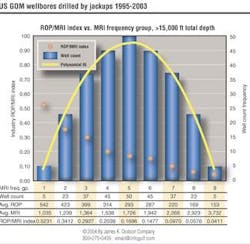
The ROP/MRI index versus MRI frequency for 270 wellbores (46% of 583 total wellbores), drilled > 15,000 ft TD from 1995-2003, shows the smaller range of ROP/MRI for deep wells. This indicates greater drilling efficiency than for shallow wells. The R2 correlation value is 0.9978.
MRI and ROP
The Mechanical Risk Index (MRI) is an algorithm of drilling factors affecting the complexity of the wellbore. When set against rate of penetration (ROP), a measure of drilling efficiency is produced to compare historic data and drilling efficiency over time. ROP/MRI equals feet drilled per day per index points of MRI and expresses the inverse relationship of ROP to MRI: low MRI = high ROP, while high MRI = low ROP.
The MRI and ROP relationship is shown for wellbores drilled by jackup rigs in the US Gulf of Mexico in the years 1995–2003.
The graphs aggregate wellbore populations, which demonstrate a normal (bell curve) relationship. The graphs presented for wells =< 10,000 ft TD and for wells > 15,000 ft TD show this relationship in the left-to-right descending values of MRI (colored spots). When displayed in this way, the ROP/MRI index range describes the drilling difficulty that can be expected when drilling a GoM well in a given depth range.
In the first graph of wells =< 10,000 ft TD, the average efficiency ranges from ROP/ MRI: 3.4587 to 0.4108. ROP/MRI ranges from 0.05231 to 0.0411 for wells drilled > 15,000 ft. Deeper wells show a much smaller index range than shallower wells, and smaller values indicate increased difficulty in drilling.
Drilling efficiency by depth
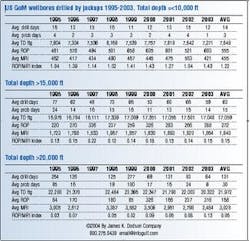
This ROP/MRI relationship takes on new meaning when placed in the context of drilling days and problem days. The table series examines these measures with ROP, MRI, and ROP/MRI for wells drilled to different depth ranges by year from 1995-2003.
The average values reflect the difficulty the industry has in drilling wells below 15,000 ft. It also shows the extreme difficulty of drilling below 20,000 ft. Expressed as ROP/MRI, shallower wells on average index at 1.22 (average three problem days), while wells below 15,000 ft index at 0.15 (15 problem days) and ultradeep wells beyond 20,000 ft index ad 0.06 (30 problem days).
The ROP/MRI index for ultradeep wells is less than half the drilling performance for wells that reach into the MMS deep shelf threshold (> 15,000 ft TD).
The cost associated with these facts is significant. To drill an ultradeep well of 30,000 ft will require close to $50 million, compared to the cost of a 17,000-ft well at $12 million. One-off wildcat drilling of ultradeep well is a very expensive and very risky business that the oil industry is not willing to jump into. It only takes one $50-million dry hole to break an exploration program. Not drilling that well is a better economic decision.
Ultradeep drilling
Deep shelf wellbores drilled deeper than 20,000 ft are a challenge that requires innovation, invention, and the will to use new deep-well technologies. Under conventional drilling practices, an ultradeep well may require a 42-in. conductor at the mud line. The casing strings would telescope down in stages to a small diameter casing at the objective below 20,000 ft. This well design is a very expensive proposition in steel and drilling time.
Newer technologies and approaches, such as expandable tubing and expendable monobore wells, exist to minimize this expense. Many technologies presented at recent meetings show that cost-affordable deep drilling can be done.
To overcome the cost and risk of deep shelf drilling, operators must coalesce with the service industry as partners to push for cost-affordable deep shelf drilling and completion technologies in a collaborative R&D effort. This will ensure that is profitable for all parties, and that ample natural gas supplies can be found.
Note: MRI and Mechanical Risk Index are trademarks and Mechanical Risk Index Calculator is a registered trademark of James K. Dodson Co.
