FPSO fleet correlations: calculating topsides weight vs. processing capacity
Key Highlights
- Topsides weight correlates strongly with processing capacity, especially oil processing, and is influenced by environmental conditions and equipment needs.
- Models show that increasing processing capacity significantly raises topsides weight, with different configurations like single or multiple decks affecting overall design and weight distribution.
- Environmental factors such as water depth and pressure impact equipment size and topsides weight, necessitating robust structural design.
Mark J. Kaiser, Louisiana State University
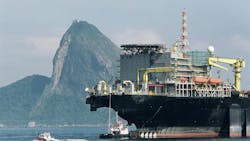
FPSOs are the most popular deepwater (>400 m) development concept in the world, comprising over two-thirds of the deepwater fleet, outnumbering all other units such as semisubmersibles, TLPs, and spars combined.
In the final part of this series, we explore the subtle relationships between FPSO topsides weight and equipment processing capacity. Topsides weight is an important feature in the design of FPSOs because deck space is constrained and the unit must be strong enough to carry all its loads, operational and environmental. Large topsides weight drives the need for a large deck and hull and a large mooring system.
Topsides weight
Topsides weight refers to the weight of the upper part of the FPSO where the processing facilities, living quarters and other equipment are located. Topsides weight includes the weight of all equipment, modules, and structures installed on the topsides, including piping, safety equipment, etc. on or above deck.
Processing requirements
High production, injection and compression requirements correspond to heavier topsides than platforms with smaller processing capacity. And since heavy viscous crudes are more challenging to process relative to lighter high-quality crudes, they generally require more equipment capacity to allow longer residence times in the separators, resulting in larger and heavier topsides.
Other factors
Environmental conditions and water depth, the number and type of risers, and fluid volumes and pressure are also determining factors of topsides weight. For example, fluids at high pressure and deeper water depths require thicker walled pipes and heavier equipment and greater topsides weight, all other things equal.
FPSOs attempting to reduce carbon dioxide emissions and permit greater onboard electrification will likely require even greater topsides weight if technological advances are not made; or allowances will have to be made elsewhere.
Topsides weight data was collected from OTC and other industry trade publications for a sample of 50 FPSOs (same data used previously in Part 4 of this series), large enough to establish a first-order approximation for general trends, but not of sufficient size for more robust evaluations.
About 20% of the sample had topsides weight <5000 tonnes and about 10% had topside weight >35,000 tonnes with the remaining units ranging between these bounds.
Relative to deadweight, topsides weight for the sample FPSOs averaged 7.4% with a standard deviation of 4.5%. About half of the sample had a TW/DWT ratio between 5-10%, and about 20% fell between 10-15%.
Over two-thirds of the sample displayed a TW/DWT ratio between 5 to 15%, which is broadly reflective of cargo vessels.
On trading tankers, cargo weight (crude oil storage) usually represents between 40-60% of deadweight, followed by lightship weight (15-25%), topsides (10-15%), and ballast (5-10%).
Processing capacity
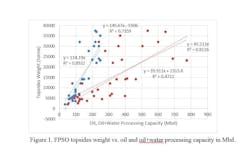
Using all the FPSOs in the sample, topside weight was parameterized with and without fixed terms against oil processing capacity, yielding:
TW = 113.9 + 104.7 OIL, R2 = 0.55
TW = 114.5 OIL, R2 = 0.85
TW represents topsides weight in tonnes (t) and OIL is oil processing capacity in thousand barrels per day (Mbd).
Removing four gas field FPSOs from the sample improves the homogeneity of the data set and increases the model fits, as one would expect:
TW = -5506 + 145.7 OIL, R2 = 0.74
TW = 114.2 OIL, R2 = 0.89.
Oil processing capacity is also a better descriptor of topsides weight than the combined oil plus water processing capacity:
TW = 2314 + 39.9 LIQUIDS, R2 = 0.47
TW = 45.1 LIQUIDS, R2 = 0.81.
LIQUIDS is the oil plus water processing capacity in Mbd.
The oil processing capacity relations are shown as the steeper curves in Figure 1, since with the addition of water processing the values of the independent variables increase for the same topsides weight. The oil+water combined variable does not improve the correlations.
Two variable models are also easy to construct. Using gas processing capacity and with oil processing capacity yields:
TW = -113 + 91.5 OIL + 15.9 GAS, R2 = 0.59
TW = 90.9 OIL + 15.8 GAS, R2 = 0.85.
TW and OIL variables are as above and GAS represents gas processing capacity in million cubic feet per day (MMcfd).
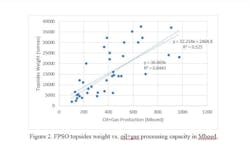
Combining oil and gas processing into barrels of oil equivalent is also a natural choice in model construction since it reduces the number of variables although it also reduces the overall information content and is somewhat less intuitive (Figure 2).
The models yield essentially equivalent results to the one variable oil models:
TW = 2465 + 32.2 BOE, R2 = 0.53
TW = 36.7 BOE, R2 = 0.84.
BOE denotes (combined) oil and gas processing capacity in thousand barrels oil equivalent (Mboe).
The latter two models are also broadly consistent with the results of a larger benchmarking study reported by DRL Engineering.
Design throughput
In an undated presentation, DRL Engineering personnel correlated topsides weight in tonnes against daily design throughput in Mboe for FPSOs grouped according to single (s) and multiple (m) decks.
Multiple deck FPSOs are a useful variable to distinguish since building up relieves deck area constraints and facilitates additional functionality and equipment. One would expect that, all other things being equal, this would result in greater topsides weight compared to single deck FPSOs.
DRL did not report regression coefficients or models fits, and the following models (without model fit) were inferred directly from their ppt graphs.
For FPSO conversions:
TW(s) = 3530 + 23.5 BOE
TW(m) = 13,824 + 23.5 BOE.
For FPSO newbuilds:
TW(s) = 42.0 BOE
TW(m) = 17,920 + 29.2 BOE.
For FPSO conversions, multi-deck FPSO have topsides weight greater than single-deck FPSOs by a fixed amount, 10,294 t (= 13,824 t - 3530 t), with a constant slope term 23.5 t/boe.
For FPSO newbuilds, multi-deck FPSOs have greater topsides weight through the appearance of the fixed-term, but the slope of the equation is not as steep compared to single-deck units (29.2 t/boe vs. 42 t/boe).
Our sample was not grouped by deck configuration and the slope term, 36.7 t/boe, falls within these bounds, as it should, so they all appear reasonably consistent.
Editor's note: This article is part five of a five-part series in which Mark Kaiser examines some of the principal features of FPSO units and how they relate across the fleet.
- In Part 1, the current inventory and lifecycle dynamics of FPSOs are reviewed.
- In Part 2, he classifies FPSOs using the equipment gas-oil ratio and shows how installations have evolved over time to handle more volatile crudes and gassier fields.
- In Part 3, he shows that FPSO dimensions and deadweight correlate in a robust fashion, so that knowledge of one parameter implies the other.
- In Part 4, he examines the relationship between two FPSO engineering design factors.
About the Author

Mark J. Kaiser
Center for Energy Studies
Mark J. Kaiser is Professor at the Energy Institute at Louisiana State University. His research interests cover the oil, gas, and refining industry, and relate to cost assessment, fiscal analysis, infrastructure modeling, and valuation studies. Kaiser has led several studies and published extensively on decommissioning in the Gulf of Mexico. He holds a Ph.D. from Purdue University.