Assessment of floater equipment capacity underpins successful development plan

Mark J. Kaiser
Center for Energy Studies, Louisiana State University
Mingming Liu
Academy of Chinese Energy Strategy
Offshore developments occur in a variety of water depths and environments and present a variety of subsurface conditions. The ability to understand the relationships between these requirements and the different types of systems is key to successful development.
In part two of this series, Gulf of Mexico deepwater floater oil and gas processing capacity statistics are reviewed.
Well production arrives topsides at different pressures, temperatures, flow rates, and compositions, and must be separated in their component streams and satisfy export pipeline specifications.
In the deepwater GoM, stabilized spec crude and dehydrated, nonhydrocarbon dewpointed sales gas are the most common processing specifications.
Topsides
Topsides includes all the equipment to separate, treat, dehydrate, and prepare production for export; to treat the produced water; compress the gas for treating and export; and to provide metering for custody transfer of oil and gas. Utilities and storage are additional system elements. In some cases, water injection and gas injection systems are required.
All systems, including well delivery, subsea systems, flowlines, structural systems, facilities, export and operations must be considered simultaneously. Different development systems fit specific requirements better than others and a systems approach is generally required to successfully integrate subsurface and surface conditions.
Trade-offs are often fuzzy and include differences that arise from:
- Capex vs. opex
- Standardization vs. improvement
- Proven technology vs. innovative technology
- Minimum capacity vs. future capacity.
The primary export options are defined according to the degree of oil and gas processing performed and whether facilities produce stabilized spec crude and dehydrated gas or unstabilized wet crude and sales gas.
Nameplate capacity
Equipment capacity is normally designed for processing requirements to match the development (right-sized), but in some cases may be built with extra capacity in anticipation of future tieback opportunities (over-sized) when owned by a third party, or under-sized in special circumstances.
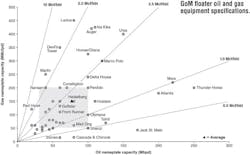
The installed nameplate oil and gas capacity for all floaters (except Independence Hub) is depicted in the below chart, and lines of constant slope gas/oil ratio G/O = 10, 5, 2.5, 1, 0.5 Mcf/bbl are overlaid. G/O ratio is similar to producing gas-oil ratio and reflects reservoir conditions and development strategy.
Groupings observed along vertical and horizontal lines are due to standardized well and equipment designs. Most GoM floater equipment capacity falls in the G/O slice between 1 and 2.5 Mcf/bbl, indicating the mostly liquid and heavy nature of deepwater reservoirs discovered to date, and all intervals are populated.
Developments in the Lower Tertiary trend (e.g., Stones, Jack/St. Malo, Cascade and Chinook) are viscous black oil developments with equipment capacity G/O < 0.5 Mcf/bbl.
Independence Hub is the only dry gas floater development and with gas processing capacity of 1 bcf/d and 5,000 b/d condensate capacity would plot in the top left off the chart.
About half of deepwater floaters have oil processing capacity between 30 and 100 Mb/d and gas processing capacity between 50 and 200 MMcf/d.
Average nameplate processing capacity for the floater inventory is 77 Mb/d of oil and 150 MMcf/d of natural gas, or 102 Mboe/d with a standard deviation of 56 Mboe/d. Annual average nameplate capacity is 40 MMboe with a standard deviation of 22 MMboe.
Five structures have oil processing capacity >150 Mb/d (Ursa, Jack/St. Malo, Atlantis, Mars, Thunder Horse) and five structures have gas processing >350 MMcf/d (Devils Tower, Ursa, Auger, Na Kika, Lucius).
Semis have the largest average processing capacity and also the largest variation among structure type, reflecting their application in both small and large field developments.
Capacity-reserves ratio
At the time of sanction/development, the production equipment and export pipelines are sized relative to the well plan and expected maximum flow rates and provides a useful benchmark on development strategy when compared to a field’s total production.
Capacity-to-Reserves (CR) ratio is defined as the oil and gas production handling capacity expressed in heat-equivalent barrels on an annual basis to total expected production expressed in boe.
Over time, nearby fields may be tied back and require processing capacity to be increased or the field may not produce as expected. In either case, the CR ratio will change, either increasing, or more likely, decreasing because of the expected direction in reserves growth.
CR is a function of time because both the numerator and denominator are functions of time. Equipment capacity is not directly observed unless reported by the operator, and subsequent changes may or may not be reported, so caution is warranted in empirical evaluations. Proved reserves are an estimate that changes over time and total reserves includes cumulative production plus proved reserves at the time of evaluation.
Equipment capacity does not include water handling, water injection or gas injection capacity.
A few examples of changing field conditions are:
- Mars was originally designed to handle 100 Mb/d of oil and 100 MMcf/d of natural gas, but with subsea tiebacks from the King, Europa, and Deimos fields, production capacity was expanded to 220 Mb/d of oil and 220 MMcf/d of natural gas.
- Shell’s Auger TLP processing capacity has been expanded three times since installation, from its original 55/130 capacity to its current 105/420 nameplate.
- Thunder Hawk was initially designed for 45 Mb/d of oil and 70 MMcf/d of natural gas, and in 2015 expanded to 60 Mb/d of oil with gas lift capabilities for the third-party tieback fields Big Bend and Dantzler.
CR ratios have a tendency to decline due to reserves growth and tieback fields that add production to the structure. If tiebacks occur when the structure is at peak production, capacity will need to be added, while if the tieback occurs during the decline stage, then capacity additions will be more limited or not needed.
CR statistics
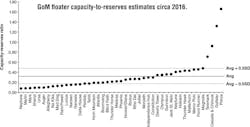
The average CR for floaters circa 2016 is 0.32 with a standard deviation of 0.31.
About 75% of the floaters have CR ratios less than 0.4 with the majority ranging between 0.10 and 0.30.
The four outliers at the high-end include:
- Cascade and Chinook which in 2016 produced 4.4 MMbbl of oil and 0.7 bcf from four producing wells in an early production system and cumulatively have produced 29 MMbbl of oil and 4.8 bcf of gas.
- Prince produced 0.7 MMbbl of oil and 1.2 bcf of gas in 2016 from four producing wells and cumulatively produced 10.1 MMbbl of oil and 11.2 bcf of gas.
- Gulfstar (Tubular Bells) had six producing wells in 2016 and has produced 17.1 MMbbl of oil and 35.6 bcf of gas to date.
- Telemark/Mirage/Titan fields produced 13.4 MMbbl of oil and 14.3 bcf of gas from four producing wells to date.
Heidelberg was the only floater excluded because its four wells have only recently started producing and reserves estimates could not be reliably computed.