P.2 ~ Continued - New DTS interpretation improves matrix acidizing offshore Mexico
View Article as Single page
Offshore testing
PEMEX used this treatment workflow in several offshore wells. The following case study represents the potential that this new stimulation approach holds to fully unlock the potential of those offshore fields.
The well was a nearly vertical cased-hole perforated oil producer, with a maximum deviation of around 9°. Total depth is approximately 19,290 ft (5,880 m) MD, presenting a slight deviation starting at 16,634 ft (5,070 m) MD. The producing zone is completed with 5 ½-in. casing and features three perforated intervals: the top one is between 18,497 and 18,550 ft (5,638 and 5,657 m) MD, the middle one between 18,661 and 18,783 ft (5,688 and 5,725 m) MD, and the bottom one between 19,032 and 19,183 ft (5,811 and 5,847 m) MD.
The formation is a mix of limestone, dolomite, and clay. The downhole flowing temperature is around 177°C (350°F), with a reservoir pressure estimated at 4,350 psi (30 MPa). Prior to the intervention, the well could flow oil with a choke at ¼ in. When opening the choke to 11⁄8 in., water was produced with a water cut up to 80%.
The objective of the intervention was to stimulate the three perforated intervals to improve oil production and reduce water production. DTS monitoring was implemented to evaluate the efficiency of the treatment and to gain additional information on the behavior of the three perforated intervals.
The intervention workflow began by running pressure, temperature, and gamma-ray memory gauges to maximum depth (the high temperature of the bottom of the well prevented the use of downhole real-time gauges). The values from this first run were later used to quality-check the DTS data obtained in the subsequent run. The ACTive BHA was then placed at 19,127 ft (5,830 m) MD and a first DTS survey was acquired for three hours to establish the geothermal baseline.
While keeping the CT stationary at that depth and with the DTS acquisition running, a preflush of diesel (40 cu m/≈250 bbl) was bullheaded down the annulus of the CT and well tubing at a rate of 3 bbl/min. The subsequent warm-back was also acquired for three hours. Based on the interpretation of the DTS data and the identification of thief and tight zones, it was decided to pump 33 cu m (≈207 bbl) of solvent, immediately followed by 10 cu m (≈63 bbl) of acetic acid through the coiled tubing in front of the bottom interval. A new DTS survey was obtained to determine whether the fluid was admitted into that perforated section.
Finally, 190 cu m (1,195 bbl) of a mixture of acetic acid, solvent, and diverter was bullheaded down the tubing and CT annulus. DTS data were acquired during both that pumping stage and the subsequent three hours of warm-back with the well shut in. Once the stimulation treatment was over, nitrogen was pumped through the CT to lift the well and put it back into production.
The main acid stage consisted of bullheading a mix of acid, solvent, and diverter. Building on the experience of the preflush stage, it was decided to gradually increase the surface injection rate in an effort to push the treatment fluid further down the wellbore, past the base of the middle perforated interval.
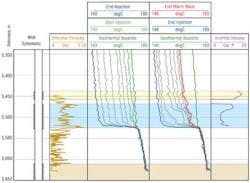
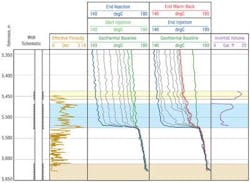
As can be seen from the temperature evolution recorded during the bullheading sequence (fourth track from left), despite an increase from 3 to 4 bbl/min, and then to 6.5 bbl/min, treatment fluid never travelled past the middle interval to reach the bottom interval. Looking at the warm-back during the shut-in period, it is clear that no exothermic reaction occurs at the lower interval of the well.
The temperatures in front of the top and middle intervals never go beyond the geothermal values; however, this does not mean that no exothermic reaction occurs, since the creation of heat by the reaction competes with the cooling effect of the injection itself (the treatment fluid penetrates the formation at a much lower temperature than that of the formation itself).
The use of the inversion algorithm in that zone helps accurately evaluate those two effects and provides a quantification of the intake across the entire interval. As noticed after the preflush injection, a portion of the middle perforated interval allowed less fluid injection than the rest (also suggested by a faster warm-back). Yet, the injection ratio changed from 38% during the initial preflush compared to 51% during the main acid treatment. This means that the top interval benefitted from the treatment and a more balanced connectivity should be expected following the intervention.

