Classifying facies using converted wave AVO attributes
Multicomponent converted shear wave seismic data offers better imaging and understanding of reser-voirs. It is well known that shear wave information, together with P-wave data, can be useful in discriminating litho-logic and pore fluid heterogeneities.
Conventional P-P amplitude versus offset (AVO) analysis offers one way of indirectly estimating the shear properties of rocks. P-S converted waves are another, more direct measure of these properties. Ocean-bottom multicomponent receivers make it possible to record converted S-waves, even when using a conventional P-wave source. P-S wave data can provide information in situations when P-wave data fail, such as imaging through gas charged sediments. Converted waves also are useful when the sands and shales have little P-impedance contrast, but significant S-impedance contrast. The use of P-S converted data for imaging in poor P-contrast situations was shown in the Alba Field by McLeod et al (1999). The rock physics diagnostics of converted wave signatures at Alba Field was investigated in Mukerji et al (2000).
Most conventional AVO interpretations are based on approximation of the Zoeppritz's equation for reflected P-P (Rpp) plane waves, such as Shuey's (1985) approximations. In practice, the intercept (A or Ro) and the gradient (B or G) are obtained directly, usually by least squares, from seismic trace's amplitudes of a common depth point (CDP) gather.
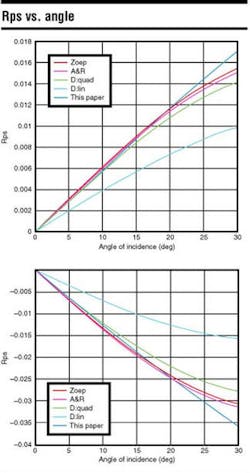
In some reservoirs, for example those with gas chimneys, the converted P-S waves have a greater signal-to-noise ratio than the P-P waves (e.g., Thomsen et al., 1997; Caldwell, 1999). This is because S waves are less attenuated than P waves when traveling through rocks with partial gas in their pores (Mavko et al, 1998). Therefore, in that type of reservoir the P-S amplitudes could be more reliable than P-P amplitudes. Donati and Martin (1998) proposed some approximations of the converted P-S reflectivity (Rps) to open the possibility of making the P-S AVO analysis a practical issue. Based partly on their derivation, a better linear approximation of Rps as a function of the incidence angle can be made.
Lithology and pore fluid classification, using Bayesian non-parametric methods, have been presented by various authors (e.g., Mukerji et al, 1998; Avseth et al, 1998). These methods not only identify likely lithofacies and pore fluids, but quantify the uncertainty associated with the interpretation. This work involves similar methods for facies classification using P-P and proposed converted P-S attributes.
Linear approximation for Rps
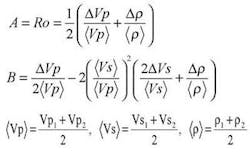
A commonly used linear approximation of the P-P reflectivity as a function of incidence angle
null
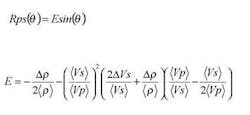
These equations are valid under the assumptions of plane waves, homogeneous, and isotropic layers with small changes between their elastic properties, and for small angles of incidence. Starting from Aki-Richards non-linear expression for P-S reflectivity, we derived a linear approximation for Rps:
null
Our linear approximation is valid up to about 25-30 degrees incident angle.
Relating P-P, P-S gradients
Combining the presented equations for the Shuey's P-P gradient (B) and for the P-S gradient (E), obtains the following linear equation:
As can be seen, the intercept and gradient of the derived linear E-B relationship are functions of Vp and Vs. Hence, those values could be used as additional attributes that might help to identify fluids or lithologies with seismic information.
Facies classification
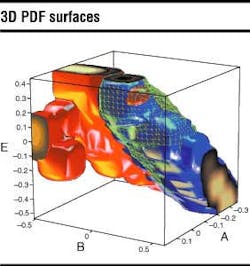
The feasibility of identifying lithologies and pore fluids was tested using P-P and P-S seismic AVO attributes. Lithology and fluid identification from A, B, and E attributes came from a Bayesian classification approach based on non-parametric probability density functions (PDFs). The non-parametric multivariate PDFs of A, B, and E for different facies were estimated from the log data, after Monte Carlo simulation of Vp, Vs, and density from their log-derived cumulative distribution functions (CDF).
In the Monte Carlo simulation, care was taken to build in the appropriate correlation between Vp, Vs, and density. Gassmann's fluid substitution equation was used to generate data for different pore fluids. For each Vp, Vs, and density co-simulated values, the corresponding A, B, and E were computed using the equations presented before. The training data was binned and the raw histograms smoothed to get PDFs that capture the overall trends without overfitting the specific idiosyncrasies of the training data. The appropriate binning and smoothing was determined by classification on a small validation subset of data.
As can be seen on the figure of iso-surfaces, there is a significant overlap between shales and brine sands while the gas sands are much better separated. These PDFs only apply to the training data used here, which was from North Sea turbidite reservoir (Avseth et al, 1998).
The Bayesian classification success rates for the non-parametric PDFs were estimated separately, using only the attribute from the training data that was used for the classification. The Bayesian success rate was obtained from the integrated volume of overlap between the PDFs of different facies (e.g., Duda and Hart, 1973). For this particular case, using A, B, and E simultaneously, the calculated probability of correct classification was around 80%, which is 15% better than that obtained with the conventional AVO P-P attributes (A, B).
The advantage of the non-parametric approach is that, unlike a linear discriminant approach, it uses more than just the means and covariances of the data. This approach can capture non-linear trends in the discriminant hypersurface. On the other hand, estimation of non-parametric PDFs may become unreliable and computationally intensive in high dimensional attribute spaces. For this study, where three attributes exist, the Bayesian non-parametric approach is a powerful method to obtain not only the most likely facies, but also the probability of each facies given the observed P-P and P-S seismic AVO attributes.
Modeling
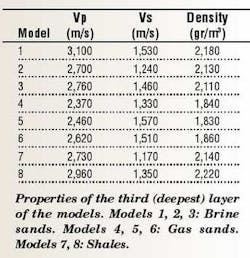
Full waveform computation to estimate A, B, and E attributes from synthetic seismograms. The seismic responses of eight models were generated using a finite difference wave propagation program. Each model had three isotropic and homogenous horizontal layers with 200 m, 300 m, 300 m, thickness, respectively. The upper two layers were the same for all models (Vp1=2,000 m/s, Vs1=1,300 m/s, rho1=2,000 gr/m3; Vp2=2,840 m/s, Vs1=1,260 m/s, rho2=2,180 gr/m3). Only the properties of the third layer were changed.
All the P wave velocities (Vp), S wave velocity (Vs), and density values were selected based on a real North Sea well log, which was also used to build the training data PDFs described earlier.
As can be seen in the table, the properties are grouped in three classes or lithofacies: brine sands, gas sands, and shales.
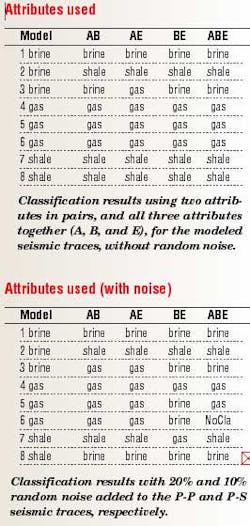
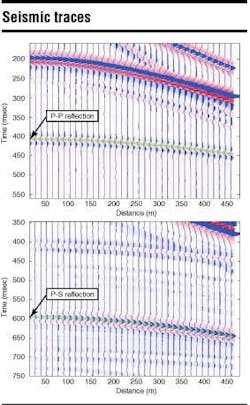
The goal of this modeling was to identify the lithofacies of the third layer using A, B and E (AVO parameters) computed with the P-P and P-S amplitudes from the second interface reflection. In addition, the classification process was repeated, adding 20% and 10% random noise to the modeled P-P and P-S seismic traces respectively. The better signal-to-noise in P-S might be representative of data over gas chimneys, for example.
The amplitudes of the reflection from the second interface was of interest. Those amplitudes were picked, and the AVO parameters calculated: A and B (Shuey's equations), and E (an approximation for Rps).
The classification used the conditional PDF, P(facies | attribute). Samples that fall in an overlapping region of the PDFs were classified according to the facies that has the highest probability at that location, in the attributes space. The cells of the tables show the resulting classification using two attributes in pairs, and all three attributes together (A, B, and E), for the modeled seismic traces, without and with added random noise. Those positions with gray background indicate an incorrect result (misclassification). As can be seen, using the combinations of A-B and A-E, and the three attributes together give the better results. Although in these tables only the classified group is presented (greater probability), the probability distribution for each cell (not shown) indicates that A, B and E together (3D PDFs) gives the results with the least uncertainty in the interpretation.
Conclusions The derived linear approximation for the reflectivity versus incidence angle, Rps(i), of P-S converted waves defines a new AVO attribute E, which can be calculated from the P-S CDP gathers, in the same way as the conventional P-P AVO attributes. There is an approximate linear relationship between P-P and P-S AVO gradients. The slope and intercept of this linear relationship depend on lithology and pore fluids. The proposed P-S AVO attribute along with the conventional P-P AVO can improve seismic facies classification.
Acknowledgments This work was supported by the Stanford Rock Physics Project, PDVSA-Intevep, American Chemical Society ACS-PRF 31675-AC2, US Department of Energy DE-FG07-96ER14723, and DE-FG03-98ER14904. The authors thank Per Avseth, Norsk Hydro ASA, and Statoil for the data.
References A complete list of references is available from the authors.
