SEISMIC INTERPRETATION: Using vision, touch, and sound for geoscientific investigation
In recent years, the resource industry has recognized 3D visualization and modeling of geoscientific data as an important part in the exploration and development of natural resources. Several research projects have demonstrated that the use of advanced computer graphics technology (virtual environments) has the potential to improve productivity and lower costs in areas such as petroleum exploration.
However, most current virtual environments focus entirely on improving the user's comprehension of geoscientific data by using true 3D (stereographic) environments, large screens, and cooperation among different disciplines. The fields of haptic force feedback devices and real-time sound synthesis have matured sufficiently over the last years to allow research of the integration of touch and sound into visual virtual environments. Both technologies have seen possible application in the geoscientific domain.
We have created a demonstration prototype called GDIS (Geoscientific Data Investigation System), which allows the multi-sensory investigation of geoscientific surface data, on which several geophysical properties are mapped (gravimetric and magnetic data). The term investigation is used to stress that three major senses (sight, touch, and sound) are used for what is usually called visualization and modeling. GDIS uses all three senses to simultaneously explore different, overlapping surface properties and accurately digitize lines on the surface.
Our experience has been that small prototypes such as GDIS are vital as research tools. After geoscientists have collected firsthand experience with new technology, their feedback frequently leads to valuable research contributions. We believe our exploration into the use of touch and sound will bring more geoscientists into contact with this new technology and will help to open up new areas of potential geoscientific applications of displaying, sensing, and mapping complex multi-attribute data sets simultaneously.
Beyond visual sense
For most humans, the visual sense is the most important input channel, and almost all computer applications focus heavily on it for human-computer interaction. Very few applications make use of two other channels (ability to feel and interact via touch, and ability to analyze data via hearing). The aim of our research is to integrate those two underutilized channels into interactive 3D systems to give the user the ability to work with multiple, overlaying properties.
Although the visual sense is still the main channel, presenting other aspects of data simultaneously through touch and sound could lead to enormous benefits (when done correctly) or greatly confuse the users (when done incorrectly). Our research aims to establish ways of successfully mapping data from its scientific domain into a useful representation of it through touch and sound.
Touching virtual objects
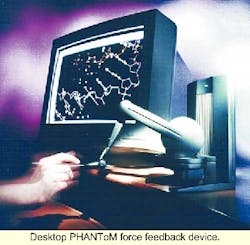
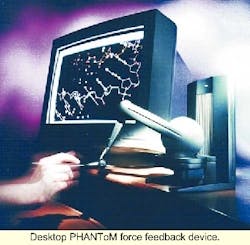
Easy access to the development of human-computer interactions via touch has only become possible in the last five years with the development of haptic force feedback systems such as Sensable Technology's PHANToMtrademark. The PHANToM is a small desktop system that can project a point force (up to 6.5 N) within its 3D workspace (16 cm by 13 cm by 13 cm ). The device creates the illusion of touching solid objects with a virtual fingertip and feeling physical effects such as attraction, repulsion, friction or viscosity.
The stylus at the end of the arm gives the user force feedback and interacts with the data in three dimensions. The use of the device as a sophisticated "3D force-feedback mouse" opens new avenues for interaction with data as it allows not only the interrogation of 3D data within a virtual space, but also as an input constraint for fine-grain interaction. In our research, we have concentrated on the haptic rendering of surface data (which is a common data type across the geosciences) on which line data can be digitized.
This allows the user to explore minute features of the surface's morphology and also use the tactile feedback to place line segments on it. In addition, the device can be used to employ force-effects such as friction, inertia, viscosity, or gravity. For example, it could give the seismic interpreter the ability to move away from verification of 3D interpretation by in-line and cross-line 2D interpretation and toward detailed true 3D interpretation of multiple data sets directly and simultaneously.
Scientific sonification
The use of non-speech sound to explore data (scientific sonification - "the use of data to control a sound generator") has been under investigation since the early 1990s. Although recent advances in real-time sound synthesis have made this technology more widely available to researchers, there are still very few guidelines on mapping data into sounds, and there seems to be no research that deals with geoscientific data. It seems to be clear, however, that sound needs to not only be effective, but also pleasant (or at least not obnoxious). As the way different people react to sound can be very different, sound mapping in an application should be highly customizable to a specific user.
The human hearing system is very well suited to detect changes in sounds (very good temporal and pitch resolution) but has difficulties determining absolute values. One advantage of sonification is that the user's eyes are free to process visual data while hearing a different set of data.
We integrated a "sound map" into the visual rendering of surfaces, giving the user the ability to listen to a local surface property while simultaneously visually observing others. In addition, we conducted a psychological study into the use of sound to convey data in an absolute way.
Absolute recognition is acknowledged to be a difficult problem, which is why our study concentrated on a fairly simple case. Our premise is that users are trained to recognize a certain small set of audio signals and connect them back to an equal number of different "ballpark values." This so-called "ballpark setup" connects, in our case, five logically progressive musical notes to a sequence such as "very low - low - medium - high - very high" in order to give the user a rough idea about local data values rather then their actual, precise values. After being trained for approximately 30 minutes, the 13 subjects were able to recognize a given audio signal correctly a significant 95% of the time. This technique was used in GDIS in addition to the more traditional relative sonification.
GDIS prototype
The computer system used in our research is an SGI mid-range workstation (Octane1) with a Desktop PHANToM attached. We use SGI's graphics toolkit, Performertrademark, for the visual rendering of 3D stereo images, into which the "3D force-feedback mouse" is integrated. Several important lessons learned about real-time visualization of geoscientific data from earlier projects have been incorporated into the graphics part of the system.
The device acts as a very precise 3D input device (< 0.02 mm resolution), with which the user interacts with the data (navigates or digitizes lines on a surface). In addition, we experimented with using the device to create a friction map, which when draped onto the surface, maps a surface variable into different values of friction. This friction map affects the ease with which the user can move along the surface (ranging from a smooth metal surface to a rubber surface).
The sound used for sonification is produced in real time through a software MIDI system, which allows easy synthesis of musical notes from different predefined instruments. Pitch, type of instrument (timbre), and duration define the sound. Although this approach could be used to sonify three independent data variables, we chose a complete overlap of the sound properties (a single data variable is described by a combination of pitch + instrument + duration).
We experimented with several mappings of data values to audio parameters and initially found that the most intuitive mapping (low data value - low pitch, bass type instrument, long duration; high data value - high pitch, soprano type instrument, short duration) can be easily understood by most people. This mapping scheme could easily be reconfigured differently. There is, however, still very little research available that would help to design more sophisticated sonifications.
Multi-sensory methods
The current system allows us to freely explore different combinations of visual (texture) maps, sound maps, and friction maps by allowing the user to designate any surface variable as either a visual, sound, or friction map. Although the pure exploration of a data set by multi-sensory means is one important aspect of our research, we also wanted to augment the commonly employed, interactive task of digitizing line segments onto a surface and extracting surface data from digitized polygons. We were particularly interested in the haptic device's ability to interact with surface morphology while simultaneously receiving input about several surface attributes via visual, acoustic and tactile means.
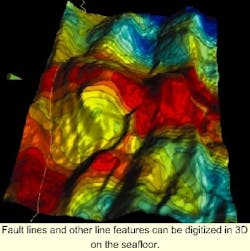
We created an application that allows the multi-sensory investigation of surface (mesh) based data. GDIS uses a hi-resolution elevation model of a seafloor (using the original side-scan sonar data) with a map of the residual mantle-boguer-anomaly (RMBA gravity map), which we used as a visual (texture) map, and a map of the age of the oceanic crust (calculated from magnetics).
The gravity is visually mapped with a Blue-Green-Red color map, the magnetic age was mapped into the audio domain, and the change of slope was expressed in the friction map. The device's "virtual fingertip" was used to digitize data on the surface. When the cone touches the surface, the force feedback allows the user to feel the sometimes-delicate surface features and get an idea of the age of the surface at this point by listening to the pitch, instrument, and duration of the currently played notes. The user is also able to perceive inflection points by feeling an increase in friction (resistance).
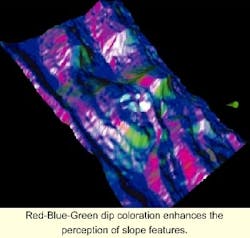
The user navigates by "grabbing" the surface with the stylus. Holding down the stylus button attaches the surface to the stylus. With the surface attached to the user's hand, the user can easily look at the surface from different angles and distances and, in general, investigate the change of surface curvature. The application offers a special surface coloring, which shows not only the magnitude of the slope, but also its direction as a change of color (dip and azimuth coloring).
Hitting the space key on the keyboard digitizes line segments - a new point drops exactly where the virtual fingertip touches the surface. The system then drapes a new 3D line segment on the surface. Line segments can be closed to form polygons from which internal points can be extracted.
Properly applied, the use of more than one sense to investigate complex data sets such as seismic reflection or other geoscientific spatial data domains promises to improve the user's understanding of the data and the ability to simultaneously interact with multiple data sets in an interpretive mode. We have taken the first step in implementing prototype examples of a system for multi-sensory data investigation.
Acknowledgement
Financial support has been provided by by the VRGeo Consortium. Stephen Barrass and Iain Mott from CSIRO assisted with sonification questions and Walt Aviles from Teneo Computing provided advice on haptics. The image of the Desktop PHANToM is copyright by Sensable Technology, Inc.
References
Aviles, Walter A. and John F. Ranta, 1999, Haptic Interaction with Geoscientific Data, Proceedings of the Fourth Phantoms User Group (PUG) Meeting
Barrass, Stephen and Bjoern Zehner, 2000, Responsive Sonification of Well Logs, Proceedings of The Sixth International Conference on Auditory Display, ICAD 2000, p. 72-80
Harding, C, 2000, Multi-sensory investigation of geoscientific data: adding touch and sound to 3D visualization and modeling, Ph.D. Thesis, Geoscience Department, University of Houston.
Harding, C., R. B. Loftin, and A. Anderson, 2000, Visualization and modeling of geoscientific data on the Interactive Workbench, The Leading Edge, v. 19(5), p. 506-511.
Kramer, Gregory, 1994, Some Organization Principles for Representing Data with Sound, in: Auditory Displays, Proceedings Volume XVIII, Santa Fe Institute, p.35-56.


