Put risk and uncertainty to work for you

If many of the important factors in your business are uncertain, if you use a lot of averages or “best estimates,” and if you don’t - or can’t - quantify your risks, then this article could make you a lot of money. For example:
You operate a warehouse out of which you sell widgets at a margin of $2 each. You can replenish your inventory every morning. You are charged $1/widget for any inventory left over from the day’s activity. Your sales average 5 widgets/day; therefore, you daily inventory five widgets. What is your expected daily profit? (Please STOP, take half a minute, and work out your answer before going to the next paragraph.)
You got $10, because average sales of 5/day times a $2 unit margin equals $10/day. Right?

Wrong! The correct answer is $5.91, because the sales are equally distributed between 0/day and 10/day. (See Fig 1).
This illustrates the “Flaw of Averages,” (Thanks to Prof. Sam Savage of Stanford University for this very descriptive name. See his “The Flaw of Averages,”Harvard Business Review, November 2002, pp. 20-21) which states that the value of a function evaluated at its average value is not equal to the average value of the function (unless the function is linear - Jensen’s Inequality. P.S. Very little in this world is linear).
Use averages only at the risk of your economic health. The right question is: “How are the sales distributed?” instead of, “What are the average sales?”
In this example, using averages would lead one to pay, say, $8 for this business, in the expectation of making a couple of dollars - only to be surprised to lose a couple of dollars, and never really understand why.
Be sure you use the same distributions for all applications of the same parameter, and avoid “normal distributions,” “standard deviations,” etc. Triangular distributions may be the most useful, at least for starters. For example one might guess that future oil price will be between $40 and $70, most likely around $50. Such a forecast as a distribution avoids the flaw of averages and, as we shall see, illuminates the risks. Or use historical data, adjusted as appropriate. Use what you know about what you don’t know. Welcome to Monte Carlo Simulation.
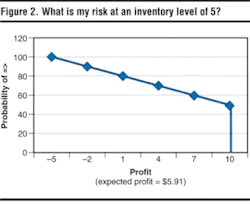
Another point to consider: Don’t ask only, “What is my expected profit (margin, cash flow, return, etc.)?” but also, “What is my risk?” Let’s use the previous example and define “risk” as the probability of losing money. For an inventory level of five, the answer to this question is given in Fig 2, which is a plot of the data in Fig 1. Thus, risk is not a number, but rather a probability distribution.
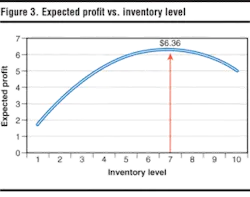
Another good question is, “How can I maximize my expected profit?” This is determined by repeating the calculations shown in Fig 1 for inventory levels of 1, 2, 3 -10 and plotting them as shown in Fig 3. Thus, an inventory level of 7 maximizes expected profit at $6.36.
Still another good question is, “How can I minimize my risk?” Or, even better, “What is my optimum strategy?” This is addressed by plotting the information just calculated, as shown in Fig. 4 for inventory levels of 5 - 8. As the inventory level increases from 5 to 7, the expected profit increases, but so does the risk of losing money.
These results should not be surprising. You must now make the often-discussed but seldom-quantified trade-off between risk and return. The dashed green arrow indicates the direction that rational persons would seek.
For example, one would not choose inventory level 8, since it represents higher risk and lower return. There is no right answer. However, by using distributions rather than averages for inputs, not only are the true expected values determined, but as importantly, the real issues are illuminated and quantified for the decision maker.
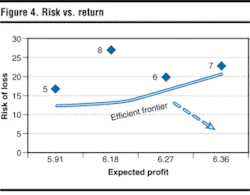
Now, what if you had several warehouses? You could optimize your portfolio by calculating the mix of each warehouse that minimizes risk for a given return for the portfolio of warehouses, or that maximizes return for a given risk. The universe of such mixes is given by the solid green line in Fig 4. One would then choose one of the strategies represented by the points on this efficient frontier - the one that made the trade-off between risk and return that you consider appropriate for your situation.
The shape and location of the efficient frontier is strongly affected by the correlations among the projects. Negative correlations (when one goes up, the other goes down) are preferable to zero correlations (all inputs are independent of each other). However, zero correlations are preferable to positive correlations (all independent variables move in the same direction). Welcome to portfolio optimization! (See “Holistic vs. Hole-istic E&P Strategies,” Ben Ball and Sam Savage,Journal of Petroleum Technology, September 1999, pp. 74-82. Society of Petroleum Engineers Paper No. 57701. Also see “Notes on Exploration and Production Portfolio Optimization,” Ben Ball and Sam Savage, www.benball.com.)
Summary: Avoid the flaw of averages. Use input variables as distributions, not averages. Use the same distributions for each independent variable in all applications. The answer is not a “number,” but a distribution. Make decisions using risk/return trade-offs, which are quantifiable. Seek negatively correlated projects. Optimize your portfolio of projects by selecting your strategy from the efficient frontier, while your competitors remain lost in the flaw of averages.
Happy simulating and optimizing!
Ben C. Ball Jr., President
Ball & Associates
This article is based on a paper given by the author at the 8th Annual Rice (University) Global Engineering & Construction Forum, “Uncertainty, Risk, & ‘Expected’ Profits, or ‘What Can I Really Expect?’” Houston, Oct. 11, 2005.
Ball & Associates is an international consulting organization founded more than 26 years dedicated to management effectiveness and economic performance through strategic planning, energy policy, and management education. www.benball.com.
