Subsalt imaging in the Levant margin and basin of the eastern Mediterranean
Grunde Rønholt
Eli Brox
Ilyes Bouzid
Øystein Lie
Martin Melhuus
Petroleum Geo-Services
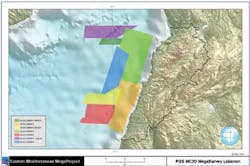
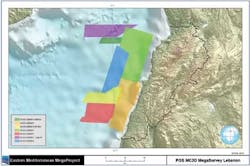
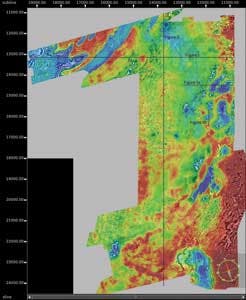
Subsalt regions are important to oil and gas companies due to significant hydrocarbon potential, although they also present high exploration and production risk. Subsalt seismic imaging is challenging and geologic constraints are essential to construct velocity models that accurately represent thegeology. PGS has improved subsalt imaging offshore Cyprus and Lebanon through the simultaneous reprocessing of seven 3D vintages of seismic data, yielding a MegaSurvey covering more than 10,750 sq km (4,150 sq mi).
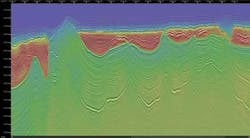
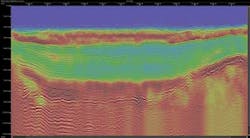
The Messinian salt offshore Cyprus and Lebanon is complex, and requires advanced and detailed velocity model work and imaging. The 3D picking procedure within the wavelet shift tomography technology enabled accurate estimates of residual velocity errors, by only select data that are positively contributing to stabilizing the tomographic velocity inversion process. The high-resolution velocity updates of the intrasalt were needed to properly image the presalt section offshore Cyprus and Lebanon for hydrocarbon prospectivity evaluation.
Theeastern Mediterranean is known for its extensive Messinian evaporites. Offshore Cyprus and Lebanon, the evaporites are complex, with large impedance variations (dirty salt). This makes accurate interpretation of the presalt section challenging, especially as the complex evaporites lead to shadow zones and poor image quality when the salt velocity variations are not properly accounted for. Plays offshore Cyprus and Lebanon are stratigraphic, fault, and/or fold related. The geological development of the basin is complex, and there are no wells within the survey areas. State-of-the-art seismic signal processing and imaging (prestack depth migration, or PSDM) have enabled PGS to resolve the complex velocity variations in the Messinian salt section. The data shown here are from nonexclusive 3D seismic surveys offshore Cyprus and Lebanon. Four of the surveys were acquired in the east/west direction due to operational efficiency and border constraints, while the other surveys were acquired in the strike direction.
The continuous PSDM coverage has led to improved presalt imaging and yields a clear image of the regional structural pattern, allowing interpretation of the depositional history of the northern Levant basin and providing the key to identifying and understanding the hydrocarbon prospectivity.
Geological setting
Within the eastern Mediterranean, theLevant basin is a Late Palaeozoic/Early Mesozoic rift basin flanked by several tectonic features; the Eratosthenes continental block and Herodotus basin to the west, the Nile Delta and associated cone to the south, the Levant margin to the east, and the Cyprus arc to the north. The basin hosts a sedimentary column of approximately 12 km (7.5 mi), with sediments ranging from Jurassic/Cretaceous to Recent in age. The Mesozoic succession consists mainly of carbonates. Sand and shale are seen closer to the margin in channelized deposits, talus and debris fans, and in more distal fan complexes. The Messinian is represented by a regionally extensive, thick package of evaporites.
Methodology
For PSDM projects, velocity updates are performed by picking residual shifts in the data and running tomographic inversion. Several tomography methods exist to invert seismic reflection data into velocity models. Among them, ray-based post-migration grid tomography (Woodward et al, 2008) and stereotomography (Lambare, 2008) have been significant. In the last decade, Beam prestack depth migration (Sherwood et al. 2008 and Rieber, 1936) has evolved into an effective way to prepare data for tomography. It consists of decomposing preprocessed data into wavelets, migration to map the wavelets to the depth domain, and reconstruction. The wavelet shift tomography technology presented here use 3D time residuals and many other wavelet attributes (Sherwood et al. 2011). The method possesses features of both post-migration tomography and stereotomography - PGS uses not only reflected waves, but also diffracted waves and turning waves, since both unmigrated and migrated information are considered.
Velocity model building
Over the survey area, the water depth ranges from ~200 m (~656 ft) near the coast, up to ~2,000 m (~6,560 ft) in the deep basin. After water velocity scans and interpretation of the seafloor, an initial velocity gradient was hung from the seafloor, including anisotropy parameters - a constant delta and a gradient epsilon function. The Top Salt event was interpreted for the entire area based on a migration with this initial velocity model. Subsequent tomographic velocity inversion updates were run with a mask of data below Top Salt. The gathers were nicely flattened through iterative updates with progressively shorter wavelength velocity updates. Following the overburden updates, the Top Salt event was re-interpreted and inserted as a hard boundary in the velocity model.
Velocity scans determined the best starting velocity for the salt layer. A gradient function with slightly lower velocities for the shallow part of the salt gave the best overall gather flatness. The Base Salt event then was interpreted for the entire area based on migration with this gradient salt velocity model. When inspecting the gathers throughout the area, it was clear that a spatially variable salt velocity was needed to focus the intra-, base-, and presalt reflectors. Tomographic velocity inversions with relatively long wavelengths were run incorporating a data mask below Base Salt. The Base Salt was refined after these updates and a presalt velocity gradient was determined based on velocity scans.
Reviewing the presalt datasets clearly showed the need for a higher resolution velocity field in the salt than presalt, so the velocity model building flow was set to run lower resolution velocity updates for the presalt section alone. After solving the background velocity in both the salt and the presalt section, high-resolution updates accounted for the rapid spatial variation of salt velocities.
Imaging
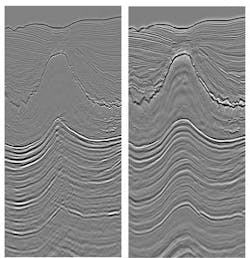
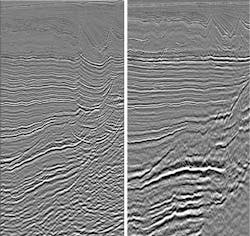
Both Beam and Kirchhoff PSDM were run with the final velocity model, and produced complementary images. The Beam PSDM result is used for a more regional interpretation due to its inherent noise reduction process and relatively clean appearance. The Kirchhoff PSDM is used for more detailed, local interpretation, due to its relatively higher spatial resolution and amplitude friendliness. The data merge before migration coupled with PSDM velocity model honoring geological complexity gave a seamless merge, even in areas with opposing acquisition azimuths. The uplift in imaging after PSDM was significant compared to prestack time migration (PSTM), provided optimum subsalt imaging and enables accurate interpretation.
Acknowledgments
The authors wish to thank the Ministry of Energy and Water in the Republic of Lebanon, the Ministry of Commerce, Industry and Tourism of the Republic of Cyprus, and PGS for the authorization to present this work.
References
Lambaré, G. [2008] Stereotomography. Geophysics, 73, VE25-VE34.
Rieber, F. [1936] Visual presentation of elastic wave patterns under various structural conditions. Geophysics, 1, 196-218.
Sherwood, J., Sherwood, K., Tieman, H. and Schleicher, K. [2008] 3D beam prestack depth migration with examples from around the world. SEG Technical Program Expanded Abstract.
Sherwood, J., Jiao, J., Tieman, H., Sherwood, K., Zhou, C., Lin, S. and Brandsberg-Dahl, S. [2011] Hybrid tomography based on beam migration. SEG Technical Program Expanded Abstract.
Woodward, M.J., Nichols, D., Zdraveva, O., Whitfield, P. and Jonhs, T. [2008] A decade of tomography. Geophysics, 73, VE5-VE11.
