Farrukh Qayyum
dGB Earth Sciences
The last few years have seen a growing focus on the importance of shallow geohazard analysis offshore, with typical geohazards including shallow gas, abnormal pressure zones, gas hydrates, slope instability, and complex seabed morphologies. In all these cases, effective pre-drilling shallow hazard analysis is essential, with the results having a crucial impact on future production operations and drilling decisions.
There are a number of benefits to conducting shallow hazard analysis in 3D seismic data as opposed to 2D. Chief among these is the increased spatial accuracy and the improved reliability of post- and pre-stack amplitudes.
3D seismic data also enables global interpretation methods to be applied in shallow hazard interpretation workflows. Such methods provide interpreters with the tools to slice through volumes of seismic amplitudes and derived attributes along geologic time lines. This in turn allows the recognition of depositional features and potential shallow hazards.
Geohazard analysis
The HorizonCube, developed by dGB, is a dense set of auto-tracked, correlated 3D stratigraphic surfaces, created by an auto-tracker, with each horizon representing a (relative) geologic time line. It combines a 3D (or 2D) stack of horizons, typically spaced in the order of the seismic sampling interval. The horizon spacing will vary laterally to reflect thickness changes.
Horizons can be tracked in two different modes. They can be tracked as truncated horizons that stop when they get too close together (when two events are getting close, only one stops), helping to identify stratigraphic lapouts such as onlaps, downlaps, and top laps. Secondly, they can be tracked as continuous horizons, staying together when they converge and never crossing each other.

This technology can influence shallow hazard analysis prior to the drilling of new wells. In a typical shallow hazard application, for example, a HorizonCube is created over the upper part of a conventional 3D seismic data set in a small area (typically covering 60 to 150 sq km/23 to 57 sq mi) centered on the intended drilling site. The focus is on the shallow section up to 2,000 m (6,651 ft) below the water bottom. A dense set of horizons is then mapped through a data and model-driven approach by tracking dip and azimuth information.
The software illustrates the input seismic data set for generating a HorizonCube where the volume is extracted from the larger 3D exploration seismic volume based around the proposed drilling location. The system creates a pseudo-stratigraphic framework for flattening any attribute that helps assess the risks associated with identified shallow hazards.
In some cases, however, the quality of the seismic prevents the data-driven approach. In such situations, a model-driven approach is more appropriate where relationships to bounding horizons, including proportional, parallel- to-upper, and parallel-to-lower, are identified.
When using this system in geohazard analysis, the Wheeler Transformation can flatten any area of interest once a satisfactory HorizonCube is constructed.
Through this process, every horizon in the HorizonCube is flat and its spacing regular. Within this flattened space, the seismic data and selected attributes can be easily and efficiently sliced in a pseudo-stratigraphically consistent manner.
Attributes can also be flattened to assess shallow hazards, such as gas-filled shallow channels, pockmarks, bottom-simulating reflectors, and faulting or truncations based on similarities.

Application
To date, BG Group has assessed 12 exploration well site locations for shallow hazards by using this methodology.
In the field example referenced here, the main interpretation goal was to accurately map the complex shallow section around the proposed well locations. Active canyons characterized the seabed and the depositional environment was reflected in the cross-cutting channelized and turbiditic deposits evident in the shallow seismic.
The interpretation of the appropriate hazard level associated with high amplitude features within the shallow section was also enhanced by the ability to slice through volumes along horizon slices. The potential connection between sand-prone channels and deep-seated faults (providing a potential gas migration pathway) could also be further risked based on potential pinchout, the isolation of sand bodies within encasing shales, and/or the conformance of sand bodies to structure.
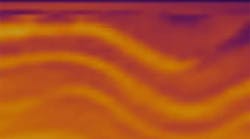
In one case, the technology illustrated one of a sequence of pseudo-stratigraphic amplitude slices shown from an 8 km-by-12 km (approximately 5 mi-by-7 mi) volume for one of the drill site locations. The slices are extracted from the continuous HorizonCube on a step of every 20 with the orange circle marking the proposed exploration well location. By going through every pseudo-stratigraphic slice, a meandering channel system was identified that warrants further investigation with different flattened seismic attributes.
In this deepwater area, seabed and immediately sub-seabed, sediments were expected to be very soft with occasional sands. These intervals are often channelized and contain sandy intervals with higher porosity. Such intervals can have a chaotic amplitude character, with bright amplitudes being associated with fluid fill or lithology. Here, the software showed an amplitude extraction from a pseudo-stratigraphic slice is shown with the brightest amplitudes in red. These features may be associated with shallow gas.

Comparing the RMS amplitudes extracted with two-way-time (TWT) extraction onto the pseudo-stratigraphic slice shows that features trend perpendicular to TWT contours. The TWT times can be used to ask the question whether the bright amplitudes are structurally conformable, which may increase the likelihood that they are associated with shallow gas. If structural conformance were observed, a Vp/Vs ratio attribute may help risk such features further.
A similar analysis revealed anomalously bright amplitudes, where a high amplitude feature is observed in a synclinal feature on the pseudo-stratigraphic slice extracted from the software. The TWT values were extracted onto the slice, with bright amplitudes illustrated in orange. The bright linear feature was interpreted to be a shallow channel. The color bar on the TWT has been squeezed to evaluate whether any bright amplitudes coincide with closure against the shallow fault observed on the pseudo-stratigraphic slice.
Through the use of this application, pseudo-stratigraphic slices are generated over a large area when compared to typical shallow hazard studies. The result is a HorizonCube created over an 11 km-by-14 km (about 7 mi-by-8 mi) area designed to cover one planned exploration well and two likely appraisal well locations, should the exploration well be successful.
Reduced risk
The HorizonCube as a global interpretation tool enables attributes of interest to be flattened to perform a more complete analysis of shallow hazards. This leads to a greater understanding of shallow hazards, and provides flexibility in the choice of well locations. •