To help its technical asset teams better identify and analyze oil and gas resources and offshore reserves, the US Minerals Management Service (MMS) Gulf of Mexico Regional Office (GOMR) in New Orleans has added a custom-made visualization center. The target is to help better use the quantity and quality of data and, consequently, make better decisions. In addition, it had to be available for presentation and collaboration purposes.
“Their requirements were very specific,” says Ken Hunter, director of sales and marketing for Barco’s virtual and augmented reality business. “In fact they wanted two different applications in one room: a high-resolution, high-quality display solution in 3D for oil and gas visualization and a solution for business presentations. Barco suggested not to make any compromises on functionality and opted for two setups instead.”
Just one day after the agreement, however, hurricane Katrina hit New Orleans. The GOMR building was flooded, abandoned, and had to be rebuilt.
“We never lost touch with the GOMR team throughout those difficult months,” says Hunter. “Our team stayed in close contact to manage the contingencies and program the milestones for planned completion.”
Barco met with the architects and construction workers of the GOMR building to check whether the proposed setup still would fit the refurbished building. In April 2007, nearly two years after the Katrina disaster, Barco began installation in the new facility.
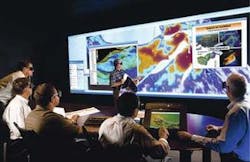
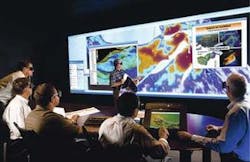
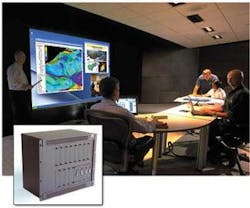
The room consists of two main parts – a large Barco CADWall for virtual collaboration, analysis, and decision-making, and a presentation display area.
“The major advantage is they can choose to run both display walls simultaneously or split the room into two parts to allow for multiple sessions,” says Hunter. “To facilitate this multi-functionality, we’ve put two separate tables in the room and chairs with casters, which allows the MMS staff to rotate between the two spaces of the same room.”
The CADWall incorporates a pair of blended Galaxy 3D stereo projectors, driven by Barco’s XDS-1000 display management system. This setup enables MMS to view a mix of 3D stereo and non-stereo data from various sources simultaneously. The large-display format allows a team to visualize and interact with high-resolution geophysical data to efficiently locate hydrocarbon reserves, to recognize and eliminate discrepancies in data, and to improve the quality of evaluations.
The iCon H600, also equipped with built-in PC and scalable desktop functionality, is for dynamic and intuitive presentations. The projector displays multiple inputs in multiple windows, and can be networked to the XDS-1000 and integrated into MMS’ network infrastructure for information access, data sharing, and resources comparisons.
Operator application
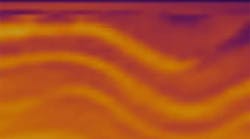
Barco implemented its most recent 3D visualization technology at RSK (UK) Ltd. in Houston. The solution, consisting of Barco’s Galaxy NH-12 projection system, allows RSK business and technical teams to view geophysical data, reservoir models, and wellbore plans at the same time to better quantify and manage risk of exploration and production assets.
RSK says the application of visualization technology has some benefits beyond expectations. It has become a tool for intellectual integration and has increased the level of understanding among the disciplines involved in a project.
“We see the data in context,” says Dick Bishop, geologist at RSK. “The system fosters invention and helps to challenge the project with the right questions. Invention is not usually the ‘aha’ moment. Rather, it comes from putting together the pieces. This lets everyone see the pieces and increases the depth of understanding.”
The resulting intangible value to Bishop is the level of communication that results.
“It revolutionizes the way you work,” he says. “It creates questions. People get insights they would not have any other way. And that is the value of this machine. It creates new things you can do, new insights to what you have, new questions you did not realize you had before.”
As an example of how the collaboration works, Bishop gives this scenario:
The engineer will say “I did not realize this could shale-out on me over there” and the geologist or geophysicist will say “Gee whiz, I did not realize we could really get that well that far.” The engineer and the geologist both now are looking at how to get the hydrocarbon out of the rock and into the wellbore.
One RSK engineer, Kirby Wells, echoes the geological view from Bishop.
“When geologists get together to discuss a rock, they bring a whole background of information about that rock…age, deposition, type. To me (as an engineer) it is still just a rock. When I talk about well trajectory, it may not be obvious to them why it is important.”
Both have found that viewing a common dimensional model at the same time helps each discipline appreciate the issues of the others.
Wells also sees the system as changing the way companies exchange information. RSK also takes a consulting role on occasion and that means reporting on its data and conclusions. The historical method of reporting is a written report with data backup. A visualization center changes that process dramatically.
“You can bring the client in for three or four days to make sure they understand how you arrived at all these conclusions,” Wells says. “They can see the maps and get our thoughts on faulting or well location or whatever to make sure they are involved in the process. If they want to change something, we can see in minutes what that will do to the NPV of the project.
“The odds of overlooking something or glossing over something small that makes a huge difference go way down. Our client’s comfort that what we have evaluated is done sufficiently goes way up.”
