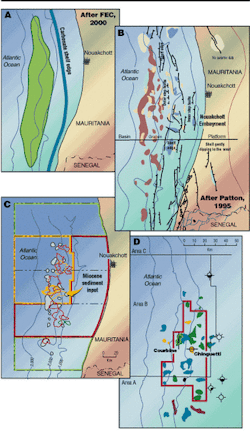
The most useful exploration techniques minimize demands on capital and staff while enabling quick and inexpensive extrapolation from discoveries into undrilled areas. A recent study, MSGBC (Mauritania-Senegal-The Gambia-Guinea Bissau- Guinea Conakry), of the Northwest African Margin Basins used geographic information system (GIS) software to combine published and proprietary information in an example imple-mentation of this utility.
The study applies simple geologic concepts while using GIS software to organize and display the data and interpretations. The scope of our work, from plate reconstruction of the South Atlantic region down to analysis of numerous mini-basins required the power of GIS.
Our initial geologic results redefined basement regimes of tectonic style and heat flow - that is, extents of continental, oceanic and proto-oceanic crust (POC) and their depths, with natural consequences for hydrocarbon maturation modeling. We then identified and mapped the structural elements of the continental margin and the areas of thickest sedimentation and salt deposition. This provides the setting for current exploration activity.
We had several goals going into the study. We wanted to manage, integrate, and display information at relevant scales, while iterating our interpretations as new data flowed in. We wanted to extend prior work, creating a framework to extrapolate the knowledge of hydrocarbon prospectivity to poorly understood areas.
Methodology
An extensive literature and web search provided hundreds of relevant papers and illustrations. We distilled the information and synthesized the content to guide our evaluation, capturing maps and sections as images. At the same time, from compilations of onshore and offshore data sets including specialized processing of the gravity data, we built a suite of gravity and magnetics (G&M) attribute images and maps of various other data. Coverage ranged from extensive and complete (gravity) to spotty (wells and seismic).
In the GIS, we correlated geological features from publications against the geotiffs (geo-referenced images). This resulted in much reinterpretation, realignment, and extrapolation of structural trends and anomalies, including many not previously imaged in their entirety. Familiar anomalies and first-order tectonic features were confirmed or refined in location and extents and a few surprises were encountered. We selected profiles in the problem areas and modeled them with the G&M, well, and seismic horizon data to revise our first pass work.
Why GIS?
We wanted to build on the excellent work in the public record. A GIS environment enables faster and more precise methods of interpretation and continued digital updating and presentation of results. Our map-based presentation of potential field attributes provided the non-specialist with direct and intuitive access to these less commonly used data sets. Referencing each interpretive element to published results allowed direct comparisons to well-accepted peer-reviewed work.
Example benefits included the ease with which multiple data sets were integrated. Published geologic cross-sections and seismic profiles were tied to our maps and set to display in pop-up windows to guide our interpretations. Hence, our results could easily be extended with commercial or exclusive data, allowing continuous validating or updating.
We ran quick quality control of bad locations (Offshore Drilling Program wells plotting onshore). We experienced an improved corporate memory as the project evolved. Our images and interpretation files could be bundled with a free multi-platform viewer providing broad and simple access for collaborative sharing and review.
Why gravity?
Getech has compiled gravity data over the continents and their margins. Satellite altimetry can be used to derive gravity values over most of the world's seas and oceans (Sandwell & Smith, 1997). Advanced processing can improve its resolution (Fairhead et al, 1998) to scales important to basin ranking, block ranking, and prospect screening.
Structural trends may not be well-defined from widely-spaced seismic profiles; tighter seismic grids increase cost and require more interpretive effort. Potential field data can clarify these trends which often control reservoir distribution and hydrocarbon migration. The combined coverage provided a unique means to rationalize and unify previous tectonic interpretations, and to link and extend features into areas not adequately covered by seismic data or drilling.
Multiple attribute displays were generated for the gravity and magnetic (G&M) grids and then displayed as geotiffs and/or contours in the GIS software. Patterns and lineations on the attribute images were compared to the published geologic features. Where one-to-one correlations were clear, features were reinterpreted and extended in map view. Usually, it was also necessary to compare typical geologic correlation sections or seismic profiles to the attribute images to determine the depths from which the anomalies originated.
First, the distal basin limits were redefined using plate reconstructions of the Central Atlantic. We built on the reconstruction results by interpreting higher resolution G&M data at more detailed scales. Next, structures and lineaments were defined and areas of volcanism, halokinetics, and sediment thicks were mapped. Gravity attribute images showed the coast-parallel syn-rift trends and their steps at the fracture zones (FZ).
Areas of likely restricted circulation were defined, which would have promoted the development of source rocks and salt layers. These correlated with a depth to basement map generated from multiple sources. Finally, the factors relevant to hydrocarbon prospectivity were summarized and compared to recent exploration activity.
Heat flow, crustal regimes
Offshore, the attribute maps showed two distinct regional domains:
- High amplitude lineaments immediately interpreted as continental
- Outboard quiet zone of oceanic crust.
The continental domain was high amplitude, dissected, and full of linear features corresponding to the continental syn-rift fabric of coast-parallel half-graben development. Discontinuities in the syn-rift features correlated with oceanic transforms such as the Kane and Guinea FZs.
Oceanic crustal regimes typically have lower heat flows and lower seafloor temperatures, so source rocks may require up to 50% more overburden than the continental syn-rift source to reach maturity. The generally thinner sedimentary section thus greatly reduces the exploration merit of the oceanic regime.
Areas just outboard of the continental regime relate to a third type, "proto-oceanic crust" or POC (Abreu et al, 1997). This material was emplaced at breakup near or even above sea level while the rift was not yet fully marine. Intruded, highly attenuated continental crust and/or earliest oceanic crust formed a series of rotated blocks that drowned as the margins cooled and tilted seaward. The region has a consistent G&M signature and is interpreted on published deep seismic profiles.
POC regions are coast-parallel, stepping at intersections with the transforms. While the POC structures are cored with non-reservoir material, they are locally high relief, promoting compactional drape traps over their crests and ponding on their flanks. Triton's recent exploration success in Rio Muni seems related to this crustal regime.
Observations
The greater MSGBC Basin takes the classic "steer's head" form with a shallow external and deep central portion. The basin is coast-parallel, long, narrow and deep, stepping inboard or outboard at the FZs. Volcanics are seen onshore near Dakar, Senegal, and offshore along the Kane and Cape Verde FZs. This fits observations from our regional work. Intrusions tend to locate only where the transforms meet continental crust or offset coast-parallel trends within continental crust.
The main sediment thick resulted from repeated continental collisions that localized the rift center. Length, width (mostly 20-60 km), and depth (12 km) infer restricted basins that would likely have been anoxic, perhaps lacustrine, and highly favorable for deposition of source intervals, and then evaporites.
Most of the diapiric or piercement features are likely salt-related, which is fortunate for a relatively unstructured basin that needs salt piercements for the vertical migration of hydrocarbons. The depth of the basin suggests early oil generation with present gas generation. This is consistent with the reported discovery of gas and oil in salt-related features on the available seismic profiles.
In fact, several sources of information have been captured as examples of the efficiency with which GIS compilations can be updated. Four different maps were geo-referenced and overlaid with transparency in the GIS project. The confusing result (full overlay of images) actually correlates well. All the anomalies fall within the interpreted basin thick from the potential field and D2B work. Several features identified on modern maps as salt piercements are seen on regional seismic lines published by Wissmann in 1982.
The direct comparison of the old and new lines in map-related pop-ups facilitates the understanding of each. It allows the interpreter to see detail in the newer lines and regional context in the older lines.
Conclusions
Scoping studies can be compiled efficiently using GIS techniques and displayed in correct map relationships using a "digital light table." Low cost, readily available data eases budgets of time and money. The trained geologic eye can rapidly review the data and highlight areas that deserve more detailed review with more expensive data.
The GIS-orientation of this study allowed easy cross-referencing and cross-correlation among all the relevant data. Each data attribute including sediment thickness, heat flow regime, indicators of hydrocarbon sourcing such as wells, DHI's on published seismic profiles, seeps, water depth, and others contributed to a robust block ranking for hydrocarbon generation. In fact this sort of classification is a strength of GIS systems.
The methodology has been used to perform quick-look evaluations and as a framework for detailed, prospect-style work while minimizing the drain on exploration resources of staff and budget. This both unlocks the value of underutilized information in scattered archives and enables better exploration decisions (Dickson, 2000).
The displays allowed us to relate exploration controls to known points and to extrapolate across blocks and basins. This leveraged inexpensive, existing knowledge and filled gaps in understanding the plays. Seismic illustrations compared historical and modern data in the same prospect trend, upgrading the value of the older work. A strong correlation was demonstrated between a source and structural fairway and the gravity signature on isostatic anomaly and other attribute maps. In particular, our salt-basin fairway correlates with the recent encouraging drilling activity.
Several techniques are available to extend the resolution of satellite altimetry and to improve bathymetric accuracy. The main thrust must be to continue to derive and present these results in ways that allow ease of access and comparison by the non-specialist to support a continued trend of ever more cost-effective interpretation.
Acknowledgement
Getech Ltd. provided gravity and bathymetry imagery for this paper. A full list of references is available from the author at Tel: 281-556-9212 or Email: [email protected].


