David R. Muerdter, Davis W. Ratcliff
Diamond Geoscience Research Corporation
Wayne K. Camp, Scott Bugosh
Anadarko Petroleum Corporation
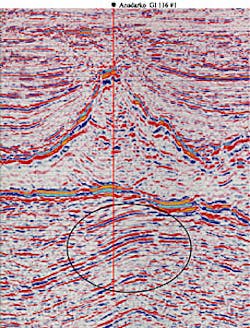
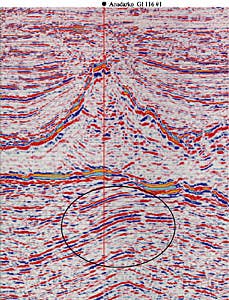
Southwest to northeast cross-section from 3D prestack depth migration seismic data. Note the high amplitude reflectors below the salt peak (circled).
Raytrace modeling differentiates false indicators
Raytrace modeling was used to identify seismic amplitude anomalies that are a result of overlying salt focusing the seismic energy. The high-velocity salt bodies in the Gulf of Mexico can act like a lens, either focusing sound energy to produce false amplitude anomalies or dispersing the energy to create low-amplitude shadow zones.
Computer simulation results can be used to assess risk factors in using amplitude anomalies as hydrocarbon indicators (HCIs). The modeling results can also be used to understand amplitude versus offset (AVO) results and to plan additional seismic survey directions and parameters.
The study area is the Hickory area in Grand Isle 116 of offshore Louisiana, Gulf of Mexico. A recent discovery well in the Hickory area found about 300 ft of pay in multiple sands. The modeling work indicated that seismic focusing did not cause the drilled amplitude anomaly. The well proved the anomaly to be a thick pay horizon.
However, the modeling indicated a nearby bright event was a focusing phenomenon and therefore it was not targeted by the first well. A field delineation well will test the modeling results by penetrating this focusing anomaly on its way to test deeper horizons.
Recent discoveries
Recently, two large subsalt discoveries in offshore Louisiana have sparked re newed interest in subsalt plays on the outer continental shelf and upper slope of the Gulf of Mexico. The Anadarko Eugene Island Block 346 #1 well at Tanzanite prospect found more than 450 ft of continuous pay in multiple sands.At Grand Isle South Block 116, the Anadarko Hickory #1 well discovered approximately 300 ft of pay in multiple sands. Delineation wells are being drilled at both new discoveries. Eleven previous subsalt discoveries, including Mahogany (Ship Shoal 349), Agate (Ship Shoal 361), Gemini (Mississippi Canyon 292), and Enchilada (Garden Banks 128), are in various stages of development or awaiting further evaluation.
Advances in seismic technology, particularly 3D prestack depth migration (PreSDM), were crucial to providing reliable seismic images below thick salt sheets. Although 3D PreSDM has been a great improvement in subsalt seismic imaging technology, there remains a need to better understand the variations in subsalt imaging quality. Raytrace
modeling is similar to the
raytracing calculated in the 3D PreSDM and proved to be
useful in determining the
seismic distortions.
An area of high amplitudes at several horizons below salt was identified as potentially prospective. Raytrace modeling was used to evaluate these and other subsalt amplitude anomalies prior to drilling. Some amplitude anomalies were caused by raypath distortions, and thus less likely to indicate potential hydrocarbon anomalies. Other amplitude targets that are not the result of raypath distortions were high-graded in the interpretation of the seismic and in planning of the well.
Velocity model
The computer model used in the raytracing was based on top salt, base salt, and subsalt reflectors that were picked from the existing 3D PreSDM seismic data. The velocity field of the model is based on the velocity volume that was used in the final 3D depth migration.The model's velocity field is a smoothed representation of the structurally complex and thinly layered earth, a needed but realistic simplification that allows computation of seismic raypaths. When raytracing reflections from a particular horizon, the rock properties below the horizon are modified to create the correct reflection coefficient for that horizon.
The values for the modeled rock property contrast are derived from sonic, density, and shear-wave logs from wells in the area. Since angle-of-incidence equals angle-of-reflection, the raypaths are unaffected by the modification of rock properties below the horizon, but the amplitudes (especially the variations with angle) are correctly calculated by the modeling software using Zoeppritz's equations.
The rock property modifications below the reflecting horizon are carefully constructed to assure that the reflection coefficient is constant over the entire surface. Therefore, the variations in amplitude for each bin on the reflector will be due to the overlying structure, not the variation in rock properties that may exist at this interface in the earth. Comparisons of the resultant maps with amplitude maps extracted from the seismic data show which amplitudes are related to structural focusing and which are more likely caused by fluid, lithologic or thickness changes in the reservoir.
Raytrace modeling
The offset raytracing used in this study is similar to the raytracing used in 3D PreSDM. Raytrace modeling allows the visualization of sound-wave paths and enables the sorting of the data into reflection point gathers. Curved rays were simulated and angles of reflection were calculated. Landmark's Depth Team raytracing and OpenVision 3D visualization programs were used.An entire 3D survey was shot over the model using shot and receiver spacing of 150 meters and a cable length of 6 km. The north-south survey direction matches the direction of the recorded 3D seismic survey in the area. All the rays from the survey were sorted into reflection point gathers. The number of hits, total amplitude, and maximum angles-of-incidence in each bin were calculated. Maps of each of these attributes were made and compared with the structure and amplitude maps derived from the seismic data.
Results
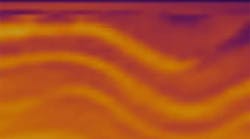
The result of the raytrace modeling is a reflection-point-gather hits-per-bin map on a subsalt reflector over the Grand Isle model. Reflections are concentrated beneath a peak of salt. Ridges of salt on the flanks of the peak also focus the reflections.Since the reflection coefficient is constant on this modeled horizon, the fold varies mainly because of the distortion caused by the overlying salt body. Other lesser factors include the dip of the waterbottom, the dip of the reflector, and variations in the velocity field.
A strong amplitude anomaly occurs directly beneath the salt peak in the extracted amplitude data at the same location as the modeled focusing anomaly. Therefore this amplitude is not a focusing effect and should not be interpreted as a hydrocarbon indicator.
We can also see the focusing anomaly under ridges on the flanks of the peak(dashed white lines). These modeling results indicate that some of the subsalt amplitudes are caused by structural focusing, and their risk of not being a hydrocarbon indicators (HCIs) should be increased.
On a different horizon, another amplitude anomaly did not match any focusing anomalies. It was high-graded as an HCI and subsequently proved to be a gas and oil reservoir by the Hickory discovery well.
Poor illuminations
The modeling results also show where there are poorly illuminated zones. These zones may have hydrocarbon potential even though they lack HCI anomalies. A seismic anomaly that is too small to be economic may have upside potential because a shadow zone masks part of the anomaly.The modeling results were also divided into limited-offset bands and individual maps prepared for near, mid, and far offset gathers. These maps as well as angle-of-reflection maps were useful in interpreting the response of the limited-offset-stack seismic volumes used in AVO analysis. Another use of raytrace modeling is in survey planning, especially in setting the best shooting direction to reduce shadow zones.
Conclusions
- Reflection-point-gather amplitude maps derived from 3D raytrace modeling show where the salt focuses the seismic energy and where there are poorly imaged areas. The modeling is valuable in interpreting seismic amplitude variations in complex data areas.
- In the Grand Isle 16 Hickory prospect, raytracing distinguished between amplitude anomalies likely caused by salt-focusing and dispersion from those that were more likely related to hydrocarbon accumulations. The Hickory #1 discovery well proved the presence of hydrocarbons associated with amplitude anomalies not related to salt focusing. The interpreted salt-focused amplitude anomaly was not penetrated in the well, but will be evaluated by a subsequent test.
- Modeling analysis can determine where amplitude anomalies may be masked or diminished by poorly illuminated zones.
- Raytrace modeling is helpful in survey design and in understanding AVO variations in complex geology.
Acknowledgments
The authors wish to thank Diamond Geophysical Service Corp and Anadarko Petroleum Corp for the use of their data.Copyright 1999 Oil & Gas Journal. All Rights Reserved.
