Vincent Vieugue
Jason Tinder
EMGS
There is no doubt that seismic data is highly effective in providing operators with structural and stratigraphic information (trap and reservoir potential) as well as volume estimation parameters such as gross rock volumes.
Yet seismic continues to have difficulties in detecting fluid content and the potential hydrocarbon volumes within the reservoir. There is subsequently a danger of operators identifying a prospect with what appears to be strong seismic, amplitude versus offset and geological potential but failing to predict the fluids. With a significant number of wells failing due to uncertainties on fluid content, this is a significant information gap.
It is against this backdrop that 3D controlled source electromagnetic (CSEM) surveys have a vital role to play in the offshore exploration workflow – accurately predicting fluids and field volumes and delivering improved probability of economic success for operators.
Predicting field volumes
3D CSEM surveys map resistive bodies in the subsurface – fluid-driven parameters that correlate strongly with the fluid content and saturation of hydrocarbons where the larger the resistive body, the greater the response.
Whereas most prospects generally have higher uncertainty in probability of success to start with based on seismic interpretation alone, adding EM data will enable better fluid predictions.
When trying to optimize and prioritize a portfolio of prospects, 3D CSEM data provides operators with the ability to polarize their portfolio and identify areas with larger hydrocarbon accumulations where they are more likely to be economically viable. This brings with it significant savings in drilling costs as well as ultimately more profitable fields.

Portfolio polarization
The impact of portfolio prioritization using 3D CSEM can be seen in the seismically derived prospects in the first two graphs.
The first represents a portfolio of prospects with the vertical axis representing probability of success and the horizontal access estimated recovery volumes by a million barrels of oil equivalent (MMboe). The second shows this same portfolio after the application of 3D CSEM where prospects with a resistive anomaly see an improvement in estimated reserves and/or probability of success and the remainder are near the economic threshold or found to be non-commercial.
The theory of portfolio polarization is to high-grade commercial prospects, disqualify non-commercial prospects, and drill high impact discoveries first. As in this example, the use of 3D CSEM with seismic, petrophysical, and geologic data enhances subsurface understanding by limiting the range of possible geological scenarios.
3D CSEM's sensitivity to net rock volume and pore fluid can result in a significant reduction in uncertainty since prospect area and net pay are associated with the highest uncertainties in reserves estimation, especially in frontier exploration areas. This dramatic difference in portfolios leads to a better classification of prospects through the downgrading or upgrading of the probability of finding hydrocarbons, and an improvement in the evaluation of the size of the accumulation.
CSEM surveys in the Barents Sea
EMGS has been commercially acquiring CSEM surveys for more than 12 years in many of the world's basins, with the last five years seeing a mature, well developed technology used with confidence, leading to better exploration decisions and improved investment returns.
One such example is in the Barents Sea, a vast under-explored area, exhibiting a large variety of geological settings and offering significant hydrocarbon potential as indicated by a working, hydrocarbon migration pathway.
To date, however, 28 exploration wells have been drilled in the area and yet only nine have proved to be commercially viable. In all nine cases, EM anomalies and resistivity were identified and in all other cases there was low or no EM responses.
For example, in well 7324/7-2 on the Hanssen structure drilled in June 2014, an EM anomaly was coincident with the discovery and resembled the nearby Wisting discovery. The 3D CSEM survey results found the largest EM anomaly in the area related to the Wisting Central structure with estimates of 132 MMboe and the second largest anomaly related to the Hanssen discovery where 18 to 56 MMboe were detected. This latter anomaly was approximately a quarter of the size of Wisting and fitted exactly with the size of proven reserves.
In the case of the nearby Mercury well, there was an apparent EM anomaly associated with the prospect but the strength of the anomaly was only one-third of that of the Hanssen prospect and subsequently delivered much smaller volumes at 6-12 MMboe. This again demonstrated a strong correlation between the observed anomaly and the hydrocarbons discovery in the area.


CSEM surveys in the Gulf of Mexico
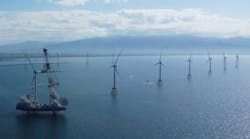
EMGS also has recently completed the 4,100-sq km (1,583-sq mi) Daybreak 3D CSEM survey in the Alaminos Canyon area of the US Gulf of Mexico.
In one part of the survey in the Great White field around the Perdido installation, the survey dropped 130 receivers and towed 702 km (436 mi) of source lines in water depths varying from 1,700 to 3,000 m (5,577 to 9,842 ft). Receiver nodes free fell into position (with all dropped within specification and 88% within 100 m of their planned location). The source was towed 30 m (98 ft) above the seafloor to transmit an EM signal into the subsurface.
Using the integrated interpretation of 3D CSEM (as seen in the resistivity map) and seismic data has been a valuable tool for several companies participating in the Western Gulf of Mexico Lease Sale 238 with 14 operators submitting 93 bids in August 2014. The 3D CSEM and seismic data will also continue to play a key role in Lease Sale 246, acquisition and divestiture decisions, and well placements in the area.
The company also has extensive experience across the border in Mexico with several published case studies. The opening of Mexican offshore exploration will see several companies using the integrated interpretation of 3D CSEM and seismic data to inform leasing decisions.
Meeting other offshore challenges
There are a number of specific characteristics of offshore fields that 3D CSEM surveys are particularly well suited to. For example, delineation wells are extremely common as a means of measuring the shape of the field, fixing the boundary of the field for greater accuracy, and for well calibration.
3D CSEM surveys with horizontal resolution, strong calibration points, sensitivity to the edges of the reservoir, and the ability to measure the reservoir's lateral extent limit the need for such delineation wells. With drilling expenditure for field appraisal the largest single expense in exploration, this leads to significant cost savings and places EM as an important direct hydrocarbon indicator (DHI).
Similarly, there are many areas of the world where seismic data is often severely compromised, due to multiples in the area with amplitudes greater than the primary reflections and significant issues with depth conversion.
Prospective salt and basalt provinces also present a huge challenge to seismic's ability to image below or adjacent to such hard lithology. The fact that seismic struggles to properly position the base of salt or basalt due to refraction and scatter makes it difficult to build an effective velocity model, which is critical to imaging capability.
In such cases, 3D CSEM surveys can play a key role in complementing seismic and providing an independent, highly reliable geological measurement that supports seismic data.
EM measures and is subsequently unperturbed by the scatter and refraction that causes seismic such difficulties and can affect velocity models. In salt and basalt provinces, the base of the salt/basalt can be accurately derived by CSEM surveys through the change in resistance and then applied to the velocity model to improve the quality of the migrated seismic image.
EM's structural imaging capabilities have been applied to some of the world's most difficult to image salt and basalt areas, such as the Gulf of Mexico, Brazil, west of Shetland, and the Red Sea.

Exploration workflow
3D CSEM surveys and data have an important place in the exploration workflow, working with seismic, petrophysical, and geologic data to develop a geological model as close to reality as possible.
Understanding that it is not always easy to bring new measurements into already robust workflows, EMGS has developed workflows and tools that can be used by operators to quickly and accurately assess the sensitivity of their prospects to EM and quantify volumes.
3D CSEM results can be incorporated into the exploration workflow and integrated with seismic and well log data to support both area net thickness, and the probability of success from structural and stratigraphic information.
Changing the exploration landscape
While seismic is a given in offshore exploration, it is only by accessing a variety of different data sources and technologies that a complete picture of the subsurface and its economic potential and risk can be developed.
3D CSEM measurements today are changing the exploration landscape – delivering improved volume estimations and ultimately, improved economic success.