Analyst predicts deepwater project revival ahead
Wood Mackenzie expects the first signs of growth since 2014 to emerge this year.
Malcolm Dickson, principal analyst for Upstream Oil and Gas, said: “2017 will demonstrate how efficient the oil and gas industry has become; showing projects in better shape all round.”
Wood Mackenzie’s global upstream outlook for 2017 predicts that the overall exploration and production spend will rise by 3% to $450 billion, still 40% below the total in 2014. At the same time, costs will continue to fall in 2017, although only marginally, with a leaner industry emerging.
Over the past two years capex deflation has averaged 20%, the analyst adds, but there is now room only for small further reductions with capital costs set to fall by an average of 3-7%.
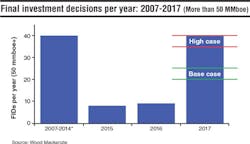
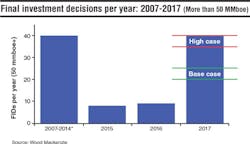
Wood Mackenzie predicts the number of final investment decisions (FIDs) for new projects will exceed 20 this year, up from nine in 2016, but still some way below the 40/yr average of 2010-2014. Typically, the new projects will be smaller in size, more efficient, and with capex/boe averaging $7/bbl, against $17/bbl for the 2014 projects.
“Companies will get more bang for their buck as development incremental internal rates of return (IRR) will jump from 9% to 16%, comparing 2014 to 2017,” Dickson said. “This is in part a result of a shift in capital allocation away from complex mega projects towards smaller, incremental projects in the Canadian oil sands and deepwater.”
Shale and offshore average the same breakeven prices
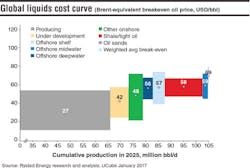
The cheapest source of new production is the already producing fields, at an average breakeven price of $27/bbl. The average breakeven price for the projects currently under development is $42/bbl. Non-sanctioned projects have a production potential of about 33 MMb/d in 2025, where shale makes up almost half of this volume. The breakeven price for offshore projects and shale is on average similar, about $56-59/bbl.
Rystad Energy’s liquids cost curve is made up of nearly 22,000 unique assets and considers each asset’s breakeven oil price and potential production in 2025. The breakeven price is Brent at which NPV equals zero, and considers all future cash flows using a real discount rate of 7.5%.
- Espen Erlingsen, VP Analysis, Rystad Energy


