Twelve structures not producing in 2016
Mark J Kaiser
Center for Energy Studies, Louisiana State University
Mingming Liu
Academy of Chinese Energy Strategy
Models are required to forecast when an oil and gas structure is expected to be decommissioned. When models are developed, good modeling practice dictates that procedures be well-defined and assumptions clear and transparent.
In part five of this series, the model framework employed in the deepwater Gulf of Mexico (GoM) decommissioning assessment is described.
The purpose of modeling is to reflect the dominant operational and behavioral characteristics of the system, as well as the limits and constraints of these characteristics. Modeling always involves a number of assumptions and preferences and the desire to make assumptions transparent arises from the need to understand the results in the context of the model construct.
Since structures exist in different states with different characteristics during their lifetime, it is not surprising that different methods are required to estimate their decommissioning time.
Life cycle states
Deepwater oil and gas structures in the GoM have been installed for drilling and/or processing operations, but in shallow water may also serve in support roles as quarters, compression and pumping stations, flare towers, etc.
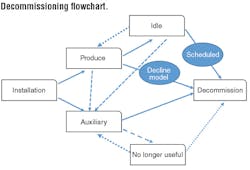
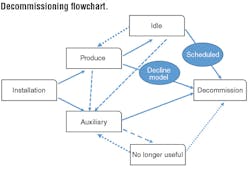
Since offshore structures are valuable assets, producing structures may be re-purposed at the end of their useful life if the structure can function in another role. Structures re-classified as auxiliary structures gain a new lease on life. The various transitions structures may take during their lifetime is shown schematically, where solid lines denote common pathways and dashed and dotted lines progressively less common transitions.
Producing structures are classified as idle when they stop producing for more than one year. Idle structures may transition back into production or into an auxiliary role, but these reverse pathways are not as common as forward paths which ‘push’ structures into decommissioning.
Decommissioning represents the end state of all structures.
Producing structures
For producing structures with net revenue greater than their economic limit, NR > EL, at the time of evaluation, a decline curve approach similar to reserves valuation is adopted.
Using producing well inventories and assumed commodity prices, economic limits, and royalty rates, cash flow analysis is applied to determine when the structure will no longer be commercial.
The primary assumption is that no new wells will be drilled, and no unforeseen problems will arise in producing wells that changes production from the modeled profile. Since side track drilling and tiebacks require capital spending and are speculative, they are excluded from the model development.
These are strong and conservative assumptions, of course, and if left unchecked, will yield decommissioning forecasts that predict early removal, much earlier than observed in practice.
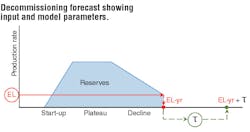
When net revenue falls below the economic limit the structure is no longer commercial, and this time is called the EL-yr.
The EL-yr is added to a user-defined time period τ representing the time until decommissioning is performed. The structure is decommissioned in year EL-yr + τ.
EL and τ are input parameters. EL-yr is derived from decline curves and τ represents historic data on the actual time observed after production ceases when a deepwater structure is decommissioned.
For fixed platforms, the time period τ is selected as three, five, or 10 years. For floaters, the time period τ is two years.
Idle structures
For structures that previously produced but are no longer producing, a scheduling method is employed by assigning a time horizon to the idle inventory in which all idle structures are expected to be decommissioned.
The time horizon T is user-defined and the inventory S determine the annual removal schedule, as S/T structures per year for T years. For example, if there are 10 structures that are not producing at the time of evaluation and a five-year time horizon for decommissioning is assigned/declared to the class (T=5), then two structures per year (=10/5) scheduled for removal will clear the inventory in the five-year period. Non-integer values in the ratio are rounded.
Assigning a time period to ‘clear’ the inventory is a heuristic procedure because private information (i.e., company plans) are unavailable and the structures themselves have no production profile to model.
Several variations can be applied to ‘refine’ the procedure but they are all user-defined and subject to the same general constraints and restrictions.
Idle structures may find a useful purpose in the future, and of course, there is a legitimate reason to delay decommissioning, especially for deepwater structures, if an alternative use is likely and the operator has the financial capacity to perform its decommissioning obligations.
The model assumes structures do not find an alternative use and removal schedules are based on the user-defined time parameter T.
Auxiliary structures
Auxiliary structures are used in support of offshore operations in ways that may not be immediately obvious without a careful and detailed review. In many cases, limitations on available data will impact the evaluation.
Auxiliary structures that serve a useful purpose in support of offshore production are likely to be removed in the far future, and thus for a short-term forecast their presence can usually be ignored.
For long-term forecasts, inventories can be assigned to the idle class and removed using user-defined assumptions.
Marginal structures
Structures producing with net revenue less than their economic limit criteria should have already ceased production.
Reality is more complicated, however, since a structure’s EL is uncertain to outside observers and will vary in complicated ways. Operators may have other reasons for operating below the economic limit and may do so for different lengths of time.
Decline models for marginal structures are therefore not especially useful in such cases since they are subject to non-economic criteria. In addition, although it is easy to modify (i.e., reduce) the EL parameters for these structures and apply decline curves, the authors prefer to group these structures with idle structures and apply a user-defined schedule.
Structure classification
From the 2016 GoM deepwater inventory, there were 26 platforms with NR > EL and 44 floaters with NR > EL and 15 marginal producers. There were also eight idle structures and four auxiliary structures.
Idle/auxiliary structures
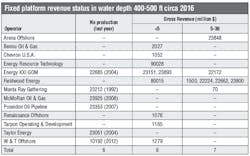
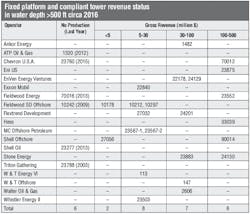
Circa 2016, there were 12 deepwater structures that were not producing.
Two of the structures are toppled (Taylor Energy’s complex 23051 and McMoran Oil & Gas 23925) and three of the structures serve as pipeline junctions (Manta Ray Gathering 23212, Poseidon Oil Pipeline 23353, and Triton Gathering 23788).
Manta Ray’s structure was acquired in 1992 when production ceased and supports the Leviathan Offshore Gathering System and Poseidon Oil and Allegheny Systems. Manta Ray Offshore was originally a joint venture between Shell Gas Transmission, Marathan and Enterprise.
Shell’s Boxer platform in GC 19 (23277) currently takes production from Jack/St. Malo.
