Oil and gas industry to see strong uptake in AUV use
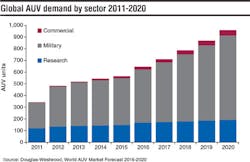
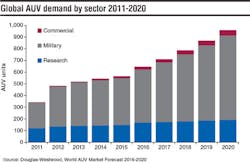
Though still a very small part of AUV usage, the commercial sector (primarily oil and gas) is growing and is expected to do so consistently over the forecast period. Douglas-Westwood expects a CAGR of 20%, driven by technological advances and increased uptake from operators looking to reduce costs wherever possible, something AUVs offer due to the reduction in manpower they allow.
Consequently, the next few years are expected to be vitally important for AUV manufacturers and operators. Both need to capitalize on increased interest before higher prices potentially lead to a return to the norm. However, low oil prices have reduced budgets and stymied investment in new technology, presenting a barrier to growth. Therefore, the onus will be on AUV manufacturers and operators to highlight the benefits of the technology.
Demand in 2020 is forecast to be 105% higher than 2016, but it is important to note that commercial demand will represent only 4% of total AUV demand. This highlights that the technology remains a niche solution within the industry. This will remain the case until improvements in battery technology, manipulation ability, and autonomy are established.
The analyst firm forecasts that the highest demand will come from operators requiring rig moves or hazard surveys. DW expects this to represent 25% of all commercial demand. Other areas that will see demand include site survey and pipeline inspection which will represent 19% and 11% of demand, respectively.
-Ben Wilby, Douglas-Westwood
New shale and oil sands are marginal sources of supply in 2020
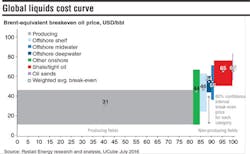
At an average breakeven price of $31/bbl, producing fields are the cheapest supply sources. Non-producing shale and oil sands are the marginal sources of supply, with high drilling/completion costs for the former and high capex/opex for the latter.
Rystad Energy’s liquids cost curve is made up of nearly 20,000 unique assets by considering each asset’s breakeven oil price and potential production in 2020. The breakeven price is the Brent oil price at which NPV equals zero, considering all future cash flows using a real discount rate of 7.5%.
For each lifecycle, associated costs are indicated as opex and capex. The width of the boxes represents production in 2020 from a given supply source. The height of the boxes shows the range of breakeven oil prices that 60% of the production lies within.


