Computed tomography offers effective tool for subsea pipeline inspection
Technology can provide asset integrity and flow assurance data in a single scan
Jim Bramlett
Tracerco
Operators are successfully adopting a unique alternative technology to non-intrusively inspect their ultra-deepwater subsea pipelines. The inspection application specifically measures both integrity and flow assurance issues within various types of pipelines that would include PIP (pipe-in-pipe), coated pipelines, piggable and un-piggable pipelines, pipe bundles, and risers.
Discovery, developed by Tracerco, is a field-proven technology that provides highresolution wall integrity data, plus detection of hydrates, asphaltene, wax, scale and other deposits for flow assurance purposes, while the pipeline remains in operation, giving quantitative results.

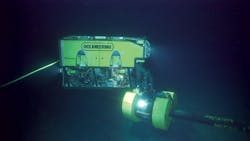
The technology is ROV-deployed and the inspection is carried out from the outside of the pipeline. It is the only non-invasive technology capable of inspecting non-piggable or difficult-to-pig coated pipelines without the need to remove and replace the pipe’s protective coating. This provides operators with cost savings by reducing the length of an inspection campaign and also mitigates the risk of damage to a line when coatings are removed or replaced.
The system also allows for the inspection of PIP systems with near millimeter anomaly detection and accuracy of both internal and external walls. It provides 360°, high-resolution scans in real time, which allows for instant assessment of the pipeline’s condition. Until now, this has not been possible without removing the protective coating.
The goal here is to describe this new technology, which is designed to help the industry address challenging subsea pipeline integrity and flow assurance challenges; and provide some examples of recent field project results.
Computed tomography
The Discovery system uses computed tomography (CT) technology to facilitate the inspection of subsea pipelines from the outside, without the need to remove the protective coating. The system was created to help subsea pipeline flow assurance and integrity specialists obtain high-resolution images of pipeline contents and pipe wall thickness, enabling pipeline integrity flaws and flow assurance conditions to be accurately visualized. The associated technology enables the effectiveness of remedial action to be verified.

The system is operated by an ROV when scanning subsea pipelines, and is rated for use at 10,000 ft (3,048 m) of water. It can be deployed on piggable and unpiggable pipelines, online, without any interruption to production or the need for pipeline modifications.
The system has been proven in field, and was recently deployed to survey an unpiggable pipeline system in the Gulf of Mexico. It was used to determine the condition of the pipelines at each scan location, with respect to pipeline integrity and flow assurance at predetermined locations. The pipelines consisted of coated single wall jumpers and pipe-in-pipe flowlines of various diameters. The survey involved deploying the Discovery system at over 200 locations and at depths ranging between 2,900 and 4,400 ft (884 m and 1,341 m) of water.
CT benefits
CT technology is the only non-invasive technology capable of inspecting coated subsea pipelines without the need to remove coatings or marine growth. CT technology enables flow assurance specialists to obtain an accurate characterization of pipeline deposits and confirm what they are - ie, hydrate, wax, asphaltene, and scale. It also enables integrity engineers to have an externally deployed method of accurately measuring defects and the remaining wall thickness of any type of pipeline.
The benefits of CT technology for subsea pipelines are:
- High-resolution tomographic images of the pipeline contents and wall thickness to 1 mm resolution, helping operators to accurately calculate the remaining life of the asset or plan remediation campaigns effectively to clear restrictions the first time.
- Production can continue and normal operations are not affected, meaning there is no further deferment of production targets and ongoing revenues are not impacted by the inspection campaign.
- Coating does not need to be removed, allowing operators to achieve considerable savings in vessel time, and minimize the risk of damaging the asset on coating removal.
- Suitable for gas, liquid, or multi-phase flow.
- Suitable for inspection of rigid and flexible lines, including pipe-in-pipe and pipe bundles, for the first time enabling inspection of the whole pipe structure.
- Real-time communications allow instant assessment of pipeline conditions, meaning decisions about remedial action can be taken quickly in order to get the asset back to full production as efficiently as possible, therefore minimizing lost production.
- Verification of the effectiveness of remedial actions to ensure the success of the action taken.
Pipeline simulations
Prior to deployment, the technology is tested with various materials to simulate the densities of the expected flowline contents and with various combinations to verify that the system is capable of determining the wall thickness for pipeline integrity and contents for flow assurance.
Flow assurance tests can also include the following:
- Tests to determine small gas channel openings in blocked pipelines to assess the possibility of gas communication between different sections.
- Tests to detect gas pressure differences in blocked pipeline channels to assess gas communications (high and low pressure) between sections of pipelines.
To determine small gas channel openings in blocked pipelines, the system is set up to scan a test pipeline, with six holes to represent gas channels in a pipeline blocked with asphaltene or wax. For the Gulf of Mexico deployment, the diameters of the holes ranged from 0.25 to 2.2 inches. Density maps were produced after two and 10 revolutions. After 10 revolutions, all the gas channels were clearly visible.
To detect gas pressure differences in blocked pipeline channels, the system can be set up to scan a pipe-in-pipe system, with four rods made of materials with densities to represent gas with hydrostatic pressures of approximately 1,770 psi and 2,500 psi. Although the system requires several revolutions to produce high-resolution density maps, operators were able to determine gas pockets in wax or asphaltene after just a single revolution. The technology can compare the density map from a single revolution (30-second scan) to the density map from 20 revolutions (10-minute scan) of the carrier spool and rods.
The system has also been used successfully on insulated pipes with piggyback lines. For example, Discovery was used on a five-layer PP (polypropylene) pipe with a piggyback line fitted with a bobbin that enable the system to clamp onto the pipeline. The resulting scan clearly showed that the pipeline integrity can be determined using the technology.
Flow assurance and pipeline integrity tests show that:
- For pipeline integrity, operators are confident of measuring defects down to near millimeter.
- For flow assurance, operators are confident of the following:
- Measuring density differentials of 0.05g/cm3
- Detecting gas pockets in wax or asphaltene after one single revolution
- Accurately measuring the density of gas pockets after 10 minutes (20 revolutions).
Also, the maximum perceivable clarity is usually obtained with scans with durations up to 15 minutes (30 revolutions); there were no noticeable improvements observed for scans that lasted up to 30 minutes.
Flow assurance
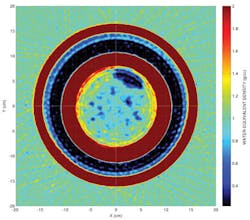
For flow assurance, the system uses a water equivalent density to produce two-dimensional density maps of the flowline contents. The density maps enable operators to evaluate the contents and deposits types. The expected deposit types include:
- Wax (0.8g/cm3)
- Hydrate (0.9 to 0.96g/cm3)
- Asphaltene (1.1g/cm3)
- Scale (1.92 to 2.65g/cm3).
For evaluating the contents of flowlines, the density maps typically use a density scale between 0g/cm3 and 2g/cm3. For example, a density map can be produced of a pipe-in-pipe system with a high density material filling about 60% of the bore and a low density material covering about 40%.
In the case of the Gulf of Mexico pipeline system, the low-density materials expected in the flowlines were:
- Gas (0.05 to 0.20 g/cm3 depending on the pressure)
- Condensate (0.70 to 0.80 g/cm3 depending on the pressure)
- Oil (0.70 to 0.80 g/cm3).
However, for evaluating build-up, density maps typically use a scale between 0g/ cm3 and 3.8g/ cm3 in order to separate the color of the scale from that of the pipe walls. For example, a density map can be produced to show the area averaged density of each band, as well as the percentage of the bore that this density band covers. For example, such an image can show that the build-up (or scale) between 1.97 g/cm3 and 3.8 g/cm3 has an average density of 2.68g/cm3, and covers approximately 30% of the bore.
The system facilitates the sizing and locating the extent of pipeline deposits. Deposits can be characterized so that the different deposit types (wax, hydrate, asphaltene, and scale) are differentiated. The technology provides results that enable efficient remediation and cleaning campaigns.
Pipeline integrity
For pipe integrity, Discovery uses a steel equivalent density to produce density maps and wall thickness plots.

Wall thickness plots detail the wall thickness as a function of angle around the pipe, and enables the wall thickness to be measured to within an accuracy of 1 mm. To assist evaluation, wall thickness plots also include the mean wall thickness and the spread in wall thickness. For example, the software can display a typical wall thickness plot where the wall thickness, shown as a green line, is a function of angle around the pipe. The mean wall thickness is the horizontal line and the spread in thickness is the vertical line. Density maps clearly show the pipeline walls and help operators identify defects. The software shows the density maps annotated with the wall thickness measurements.
Other features allow the system to measure the wall thickness measurement for a section of a pipe-in-pipe system that is within the allowable tolerance and the wall thickness measurement for a section that is outside the allowable tolerance. The section outside the allowable tolerance will be clearly visible on the density map.
Key characteristics
Some of the key characteristics of the Discovery system are:
- Fully operational and field proven (TRL 6)
- DNV RP-A203 certified
- No need to remove any type of coatings
- Provides detailed images of all pipe walls and contents
- Fully characterize the location, amount and types of deposits prior to remediation
- Reduce costs on remediation campaigns
- Reduce overall integrity costs and lifetime extension costs.
The technology is non-intrusive, with no interruption or risk to production. There is no need for coating removal or replacement. And for pipe-in-pipe systems, the system can confirm the integrity of outer and inner pipeline from the outside.
Acknowledgment
Based on a paper presented at Deep Offshore Technology International, held Oct. 13-15, 2015, in The Woodlands, Texas.