Gary Yu
Geotrace Technologies
Pressure data including, but not limited to, hydrostatic pressure, pore pressure, overburden pressure, fracture limit, and effective stress are invaluable to engineers and drillers for well design as well as to oil companies fordrilling risk management. Additionally, pressure data is applicable not only for conventional plays but also for unconventional plays such as shale reservoirs.
The following explains the pressure fundamentals, highlights the importance of velocity accuracy, and describes a calibrated pressure model that transforms high resolution (HR) seismically derived velocity into accurate quantitative pressure information that addresses today's challenge of high drilling cost, green environmental requirements, and financial risk management.
Understanding abnormal pressure
There are many causes for abnormal pressure. Failure to consider all factors may produce an inaccurate pore pressure prediction and eventually result in well abandonment, expensive side track, well blowout, or stuck drillpipe, not to mention other drilling hazards associated with abnormal pressure. There are three categories of causes:
- The interaction of compaction and undercompaction, i.e., stress changes in the rock matrix. This is the primary and most understood cause for abnormal pressure, especially in sedimentary basins. During the burial process if pore fluids cannot escape (dewatering process) due to a low permeable overlying formation, at a rate sufficient to keep up with vertical stress from overburden, under-compaction and abnormal pressure occur.
- Burial history is a secondary cause of abnormal pressures. The process of dewatering and expulsion of pore water also can be triggered by hydrocarbon maturation, thermal effect, clay diagenesis, and time span after deposition. These so called "unloading mechanisms" introduce abnormal pressure in the formation pore spaces as the rock matrix constrains the increased pore fluid volume. Other unloading means such as structural uplift or erosion also can reduce effective stress and abnormal pressure.
- Fluid dynamics is another secondary cause and a sub-branch of fluid mechanics dealing with fluid flow. Oil, gas, or water from a higher pressure formation can be injected into another formation under compaction. This fluid movement or lateral transfer subsurface can happen between two formations along fault planes or an inter-connected network of porous reservoirs and faults. A product of lateral transfer is centroid - the point where the pore pressure in a formation reaches equilibrium. This is why when well drilling the crest of a structural reservoir; the pore pressure can be much higher than the surrounding sealing formation.
Improving seismic velocity
Transforming seismic velocity into pore pressure and other pressure data is reliable, proven technology. However, two prerequisites are often overlooked in attempts to extract an accurate and geologically meaningful velocity volume for pressure estimation: seismic data quality and resolution.
There are three main approaches to extracting seismic velocity for pressure data estimation: normal moveout in time imaging, prestack seismic inversion, and tomography in depth imaging. The cost of each solution increases from moveout velocity to inversion and to tomography because more effort and time is involved.
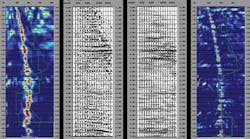
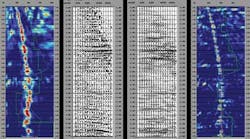
To extract the best velocity, it is essential to properly image seismic data with highest signal-to-noise ratio (SNR) and highest resolution. Geotrace has a rigorous workflow to improve data quality and a unique technology, Bandwidth Extension, to enhance data resolution. The combination of better seismic data quality and better resolution produces a high density HR velocity volume from all three main velocity solutions for moveout velocity. Finally the HR seismic velocity is calibrated with log measurements to make it a HR geological velocity volume for accurate pressure data estimation and quantitative pressure interpretation. In addition, geoscientists can use seismically derived geological velocity for time to depth conversion in mapping and velocity model building in depth imaging.
Building a calibrated pressure model
Once the causes of abnormal pore pressure are understood and the geology-calibrated HR seismic velocity volume is derived, the key of successful pore pressure estimation is to construct a calibrated pressure model that accounts for those causes. First, a theoretical pressure model is built to transform geology-calibrated seismic velocity to pore pressure and other pressure data by accounting for undercompaction, burial history, and fluid dynamics.
Then, nearby wells and drilling data including logs, mud weights, temperature gradient, leak-off test (LOT), repeat formation test (RFT), etc. are incorporated to construct the final calibrated pressure model by fine-tuning the coefficients in the theoretical formulas with proper iterations.
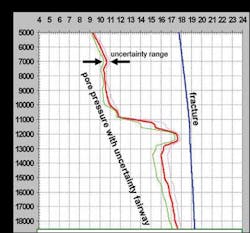
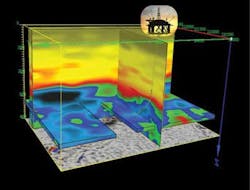
The calibrated pressure model produces 3D volumes of hydrostatic pressure, pore pressure, overburden pressure, fracture limit, and effective stress for assessing various pressure impacts and their spatial distribution, devising well path, designing well and casing points, and planning mud program. The profiles of pore pressure and fracture pressure in mud weights along a proposed well path can be used to better design the well, mud program, and risk mitigation. An uncertainty fairway around the predicted pore pressure also is estimated to give engineers a better idea of the probable error ranges to plan a contingency program and reduce potential downtime.
Selecting the best technology
Pressure prediction is becoming routine for many operators. The proprietary calibrated pressure model generates not only pore pressure and fracture pressure but also other pressure-related data such as seismic-derived geological velocity, overburden pressure, equivalent mud weights, and effective stress. By integrating all this pressure information, drillers and engineers can make proper decisions for well design, casing string purchase, casing seat position, and mud program, and optimize drilling without formation damage, circulation loss, tool stuck, or well blowout
Pore pressure can also be used to assess seal integrity assessment, hydrocarbon accumulation column height, and fluid migration when used with time-lapse 3D seismic.
This calibrated pressure model together with HR geology-calibrated seismic velocity offers a plethora of pressure attributes for a holistic solution. It encapsulates the information in such a way that when used within a powerful 3D visualization system users can get detail never seen before.
The right technology can unleash the full power of integrated seismic data, seismic velocity, pressure information, and engineering data to make better well planning, safer drilling, and more robust risk management.
