Study aims to enhance ultra-deepwater well design
Marco Chavez
Gonzalo Garcia
Oje Pogoson
Lisa Yu Li
Andres Cardona
Roy Nelson
Baker Hughes
TheUS Gulf of Mexico has long served as a staging ground for offshore drilling and completion technologies and methodologies. Ultra-deepwater is proving to be no exception, as exploration and production companies move to develop the Lower Tertiary play. Within this play, the Wilcox formation embodies both the prize of ultra-deepwater development and the challenges that must be overcome to claim it.
Successful exploration and appraisal activities since the first well in 2001 in the Baha prospect have shown the Wilcox to be a major oil resource. Production began in 2010 from the Great White/Tobago field and in 2012 from theCascade/Chinook field. However, commercial development of significant discoveries will require new completion technologies and methodologies to ensure viable delivery from a low-porosity and low-permeability reservoir with high bottomhole temperatures and pressures. Baker Hughes has undertaken an integrated study to develop an encompassing well completion design methodology to enable stimulation and production performance prediction for the Lower Tertiary, primarily the Wilcox formation. The study includes reservoir characterization, optimized hydraulic 3D fracture design and modeling, nodal analysis and production forecasting, and reservoir simulation to determine optimum well completion requirements such as internal tubing diameter, completion tool inner strings, and downhole control valve sizes.
Wilcox trend overview
The Wilcox trend extends approximately 400 mi (644 km), from Alaminos Canyon in the west to Atwater Valley in the east. The formation lies beneath water depths from 12,000 ft (3,658 m) to 33,000 ft (10,058 m), with approximately 20,000 ft (6,096 m) TVDSS. The dominant sediment source is onshore deltaic, with clastic sediments deposited in a complex slope system, resulting in mini-basins and base-of-slope fans. The basin is predominately a Louann salt.
Well completion technology for ultra-deep reservoirs must be rated for high pressure and temperature, must minimize pressure losses in pumping and production, and must be capable of multi-zone, single-trip (MST) completions. Understanding reservoir behavior helps define the lower and upper completion requirements for maximum well deliverability. Reservoir pressures in the Wilcox formation range from 7,000-30,000 psi (482-2,068 bar), with accompanying temperatures of 130-300°F (54-149°C). Effective porosities range from 7-29%. Permeability is generally 10 mD or less, with the exception of the Wx 1A unit in the Alaminos Canyon area which is 50 mD, with a reservoir thickness in the range of 1,000 ft, and hence, the reservoir capacity k-h is in the range of 50,000 mD-ft and that tells about the potential of this reservoir in particular. Wells in the western portion of the trend tend to be shallower, while wells in the eastern portion tend to be deeper and hotter. The risk of sand production is very low across the formation.
Designing for deliverability
Three key factors improve well deliverability: hydraulic stimulation, surveillance, and zonal flow control. Hydraulic stimulation requires high pumping rate (and pressure), a modular system, and an optimal fracture half-length. Surveillance includes zones that are flowing or shut in, and pressure and temperature on mechanically isolated zones. Zonal flow control encompasses producers and injectors and flow control valves where zones may or may not contain one or more fracs, and should minimize flow between zones.
Five well completion themes were addressed to mitigate operational risks and improve reliability and well productivity. These included data input; fracture design; multi-zone, single-trip frac completion; flow analysis; and reservoir simulation.
Data input. A representative well containing the most pay-zone information for the Wilcox reservoir was selected, and the original log in LAS format was used to prepare the theoretical log profile for a well containing the longest expected horizons for this reservoir. The initial LAS log was stretched from around 800 ft (244 m) MD to an assumed TD of 3,000 ft (914 m) MD to get representative curves for the required parameters and rock properties for a proper frac-pack design. Data were gathered based on results from actual log parameters, and stretched to satisfy the requirements of a 3,000 ft MD gross reservoir height, conveniently stimulated with optimized frac-pack designs to ensure total coverage of the reservoir height.
Fracture design. Although no fines migration or formation sand is expected in the Lower Tertiary, a frac-pack simulation was performed to determine the operational conditions and equipment speciation needed to optimize the well deliverability. Additionally, the frac-pack completion will prevent proppant flowback, formation grain disaggregation, or other problems with production drawdown. Assumptions included a homogeneous formation with minimum closure stress higher than pore pressure, and vertical fractures parallel to the maximum horizontal stress and perpendicular to the minimum horizontal stress. It was also assumed that a single multi-zone completion with existing tool systems could accommodate the number of stages required to frac-pack the entire reservoir. For the same set of data and after evaluating different IDs for the multi-zone tools system, a bigger ID for the multi-zone tool system led the company to confirm that an ultra-deepwater reservoir could be stimulated in as few as five stages, using a multi-zone, single-trip system, and performing treatments at rates as high as 50 b/m.
Multi-zone single-trip frac completion. The study focused on a five-zone, single-trip multi-zone completion system for installation in 8.5-in. (21.6 cm) drift casing. Bore sizes of 3.75 in. (9.5 cm), 51⁄8 in. (13 cm), and 6 in. (15.24 cm) were evaluated. Pump rate requirements from preliminary fracture designs revealed the necessity of a large-bore system to accommodate large internal multi-zone work strings, reduce friction pressure loss at high treatment rates, and enable installation of a large-ID internal production string and flow equipment. Production ratings were determined for both installation and production scenarios. Installation ratings were established from detailed fluid hydraulics obtained from the preliminary fracture modeling. Production ratings were based on expected bottomhole pressure changes over the life of the well.
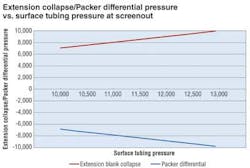
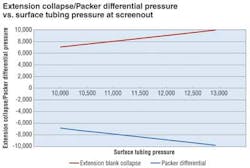
Specific hydraulics data from the preliminary fracture design were combined with other well data to calculate the expected packer differentials and collapse pressures encountered during fracturing and pumping. Basic fracturing and crossover tool hydraulic equations were applied to each data set to show points at which the highest packer differentials and extension collapse ratings are encountered. Similar calculations were composed for fracturing base densities. Results showed that higher fracture base fluid density aids reduction of surface treatment pressures from increased hydrostatic pressures. The resulting friction pressures from fluid flow do not always counteract the reduction in hydrostatic pressures.
Hydraulics data sets that consider internal work string sizes of multi-zone systems were also evaluated. Results showed that the bore size of a multi-zone completion system is largely impacted by surface treating pressures, which in turn are related to the internal diameter of the work string.
Pressure differential ratings of packers were evaluated for initial, mid-life, and depletion-case production scenarios. While differential pressures in the mid-multi-zone packers may not change dramatically over the life of the well, the top multi-zone completion packer tends to encounter high packer differentials if and when production zones are depleted. Fluid and pressure management are required at some point during the life of the well to keep packer differentials within equipment rating limits.
Flow analysis. For this study, the flow analysis was to calculate maximum fluid production constrained by pressure drop and erosion across various completion options. The flow analysis encompassed inflow modeling, nodal analysis, and entire completion modeling to assess flow rates, pressure losses, and erosion velocities. The analysis comprised commingled production from five zones with various reservoir properties.
There were five open zones, each of which was assumed to produce directly through the frac-pack. Inside tubing flowed across the system, from the reservoir to the wellhead. A constant configuration from the wellhead to the sand control packer consisted of 5.5-in. (13.97-cm) tubing installed from the wellhead to the subsurface safety valve (SSSV) and 4.5-in. (11.43-cm) tubing from the SSSV to the sand control packer.
The analysis also varied the pipe diameter from the sand control packer to production zones. The first situation was theoretical and assumed base pipe from the lowest zone to the sand control packer. The second situation corresponded to 4.5-in. (11.43-cm) tubing OD deployed from the lowest zone to sand control packer. The third situation encompassed 3.5-in. (8.89-cm) tubing OD from the lowest zone to the sand control packer. The final situation assumed 27⁄8-in. (7.30-cm) tubing OD from the lowest zone to the sand control packer.
With no consensus about the erosion limit in the oilfield industry, this study used the API RP 14E norm, which describes the methodology to estimate the erosion velocity limits without sand production. The highest erosion occurred in the 4.5-in. (11.43-cm) tubing, with production limited by the vertical lift performance (VLP) of the well. For this study, the highest reservoir drawdown was 3,820 psi (263 bar).
Reservoir simulation. Well completion equipment - including sand-face completion, fluid control valve device, production packers, production tubing, SSSV, and frac-pack service tools - establishes or limits production during the life of the well. Limits can arise from increases in fluid velocity, hot spots at the sand face, or uneven influx that produces fluid concentration in specific areas. A simplified well completion-reservoir model was constructed using available public data and fracture dimensions to evaluate water production, fluid distribution, cross-flow, fracture conductivity, and equipment.
The simulation identified that only in early well life is higher liquid production achievable without exceeding the erosion limits from API RP14E, because lower fluid density shifts erosion velocity limits downward as the well ages. The downhole control valve must mitigate cross-flow and water production, while total fluid production must be reduced during higher water production so as not to exceed erosion velocity limits. Drawdown is near 3,000 psi (207 bar) for a fluid rate of 30,000 b/d (4,770 cu m/d) with 3.74-in. (9.5-cm) ID. The opportunity exists to produce natural flow with low reservoir pressure depletion. Otherwise, an ESP is needed to boost fluid to the surface. For the low bubble point reservoir and considering the drawdown expected, no asphaltene precipitation at the reservoir level will occur. Although, potential asphaltene issues near the subsea wellhead or pipeline could occur.
Additional study conclusions
- Proppant size and type impact frac-pack geometry results. The selected proppant in the Baker Hughes research was bauxite 20/40 mesh.
- The surface treatment pressure required to stimulate selected zones can be reduced by using alternative heavy frac fluid systems.
- Using larger, multi-zone inner string internal diameters reduces the number of the stages necessary to stimulate the entire formation and enables higher fracturing rates because of a significant reduction in friction pressure.
- If 27⁄8-in. (7.30-cm) tubing is used in the lower completion, the maximum potential production is 23,000 b/d (3,657 cu m/d), with a maximum drawdown of 2,441 psi (168 bar). Production is constrained by a C factor of 300.
- To produce 30,000 b/d (4,770 cu m/d) within acceptable erosion factor limits, the necessary internal diameter is 2.991 in. (7.6 cm).
- Technology and completion requirements can be assessed from flow analysis to determine if larger holes and tools are necessary.
- Currently, flow assurance results are interpreted from key fluid properties such as API, GOR, bubble pressure, fluid viscosity, and formation volumetric factors. More complete analysis is possible if more reliable PVT data, SARA analysis, and water characterization analysis is provided.


