Alternative approach required to contain costs of remote Australian offshore gas fields
Martin Stewart
Granherne
Historically, gas field developments offshore northwest Australia (NWA) have been founded on large accumulations, in shallow water, with relatively short distances to shore. Sustained production was possible as a result of large, highly productive reservoirs.
In the search for new gas reserves, exploration and production companies are acquiring significant acreages in increasingly remote, deepwater offshore northwest Australia. Recent discoveries tend to be smaller accumulations, some with significant faulting and most with varied reservoir compositions, pressures, and temperatures. The regional challenge posed is to achieve cost-effective developments in these marginal environments.
Results from recent development studies illustrate demonstrable relationships between functional design choices and facilities total installed cost (TIC). Challenging these choices through the application of front-end loading techniques allows the necessary balancing of competing development drivers to achieve an economically viable development.
Offshore oil and gas developments in NWA incur a much higher development cost than in other major oil and gas hubs, such as the North Sea and the US Gulf of Mexico (GoM).
A recent study by the Business Council of Australia compared the costs of resource projects in Australia to the US Gulf Coast. It found a 40% cost premium for resource projects overall, and a 200% increase for offshore oil and gas developments on the back of lay barge and drilling rig costs. Research by Deutsche Bank (2011) found that the current proposed and sanctioned Australian LNG projects are far more expensive than recent projects worldwide. Current projects are estimated to cost $2.7 billion per MMtpa compared to $1.7 billion per MMtpa for existing projects (North West Shelf Venture and Darwin LNG) and $1.2 billion per MMtpa for recently commissioned projects globally.
For NWA projects sanctioned to date, the quality and accessibility of gas fields have allowed profitable development despite the cost pressures. The major gas producing fields in the region have large, centralized reserves capable of high productivity wells, and are found in shallow water on the continental shelf or in deeper water in reasonable proximity to shore.
Early project development typically follows this sequence:
- 1. Gather and process field data
- 2. Define development rules
- 3. Brainstorm development concepts
- 4. Conduct preliminary engineering definition
- 5. Develop cost, schedule estimates, and economic outputs.
Balancing competing drivers
In recent years, operators have begun to develop more challenging, marginal gas fields farther from shore, in deeper water, with distributed reserves requiring a higher number of wells. For many projects, the application of "typical" engineering methods has resulted in development concepts too expensive to proceed, requiring substantial engineering recycle and cost challenge phases to render the concepts economically viable.
In every development there is a limited pool of available resources - time, money, people, equipment, customers - and constraints in one or more of these areas always apply. Thus, project developers normally seek a balance among the three areas of cost, schedule, and quality. Quality in this sense includes increased operability, safety in design, availability, reduced maintenance downtime, incremental capacity, and provision for expansion.
This trade-off most often focuses on the issues with the most impact on economics (other than reserves and product price), generally development project capex and schedule. Capex/opex economic trade-offs usually favor reduced capex, as this has higher net present cost. Schedule defines the start of project revenue, impacting NPV and IRR.
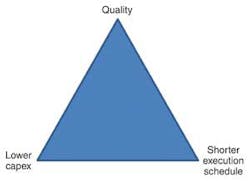
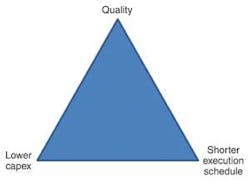
A project management triangle representing quality, capex, and schedule is a figurative reminder that there is always a trade-off among the three. Moving toward one goal involves moving away from at least one of the other goals.
Engineers are typically responsible for ensuring that their concepts are technically robust and can stand up to challenge. The business unit, through the project manager, is concerned with creating a viable business solution, and focuses on cost and schedule. When the project reaches Stage 5 for a marginal development, cost is typically too high, sending the project into recycle at one of the earlier stages.
When internal recycle and utilization of local engineering resources do not deliver an economic outcome, parallels are often identified between fields being considered for development in NWA and many developments in the GoM, a region which has had success in developing small and varied accumulations at sufficiently low capital cost. By studying a number of recent deepwater gas developments, an understanding develops of the cost differences between developments in the two regions. Correct framing in the feasibility and select phases of a project can achieve lower cost outcomes while minimizing engineering recycle.
Methodology
A case study was initiated comparing development of a field in NWA (Case A) to a fictional equivalent in the GoM (Case B). The two developments were identical in terms of:
- Reservoir size, depth, and characteristics
- Gas and condensate production rates
- Formation water production rates
- Distance from shore
- Water depth
- All wells were subsea, with tiebacks to an infield floating facility.
Drilling and completioncosts were excluded as these were essentially non-differentiating within the study framework.
Cost differentials between cases A and B were divided into two main categories: Regional and Design Choice.
Regional differences are a function of the geographical location of the field. Any project has limited capacity to influence these variables. Key regional differences include: geotechnical and metocean conditions; regulatory framework, applicable statutory codes and standards; and transport, freight, and installation vessel costs.
Design Choice covers every element that is not region-specific, including: topsides design philosophy; equipment sparing; material selection; subsea architecture; flow assurance strategy; contracting strategy; installation methods; and materials and equipment procurement costs.
Material and equipment procurement costs are considered a design choice; transport and import tax aside, they are largely driven by the commercial arrangements, tendering processes, and technical specifications used.
With the cost differentials identified, further examination into each was conducted to understand the reason behind the difference and to identify the conditions under which the GoM approach and cost might be applicable in NWA.
Results
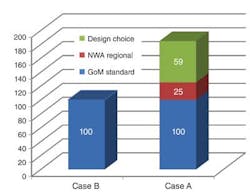
The comparison determined an 85% capex increase from Case B to Case A, indicating strongly that most of the cost difference between the regions is not driven by geographic necessity. However, an equivalent design choice may have a different technical and commercial impact in NWA compared to the GoM, thus the lower capex option is not necessarily the preferred choice for a development.
Regional differences explained a 25% cost increase from Case B to Case A, split into three categories: metocean influence; transport; and installation cost, vessel mobilization, and day rates.
Metocean influence accounted for less than 10% of the regional difference. Transport costs were slightly lower for Case A due to proximity to fabrication yards in Asia. The impact of regional location on installation costs was, however, overwhelming, accounting for more than 90% of the regional impact. With a limited number of vessels available for deepwater pipelay and subsea installation, the cost of mobilizing and using these vessels is disproportionately high, even with transition time to and from NWA factored in. Moreover, day rates in some instances are several times those in the GoM for the same or equivalent vessels.
Australian maritime requirements and significantly higher crew costs account for part of the differential. However, high rates for installation vessels in NWA are primarily commercially driven rather than cost driven. In order to minimize installation costs the commercial strategy should be examined early in the project life, considering opportunities such as:
- Sharing major installation vessels with another project in the region
- Conditioning design to increase the number of suitable vessels
- Negotiating early with vessel owners to select a suitable time window that ties in well with their other commitments.
Design choice accounted for 75% of the cost increase from Case B to Case A. The context for design decisions is different between the two regions due to several key reasons:
Criticality of supply. Gas fields in the GoM are numerous and feed into a reticulated domestic gas network. An interruption in supply from one field is easily accommodated by other fields. An outage will result in deferred revenue, but minimal contractual or reputation impact.
Conversely, the distance of the NWA fields from their end users means that all but the smallest gas fields feed in to LNG production, with any given field typically providing a large proportion of supply to an LNG plant. An offshore outage could easily result in an onshore shutdown. LNG end-users demand a very reliable supply, and failure to meet a cargo can have substantial contractual penalties and reputation impact. Demurrage of waiting tankers may also add significant cost.
Supply chain. The supply chain for equipment, skilled vendor personnel and installation vessels is substantially stronger in the GoM, resulting in much shorter times for major repairs on a platform or subsea system and corresponding greater reliability required for the same availability for the equivalent design in NWA.
Regulatory environment. GoM operators follow Code of Federal Regulations (CFR) and API recommended practices. Many operators will surpass these minimum requirements with their own company codes and standards. As well as meeting prescriptive guidelines, Australian companies operate under a safety case regime, with quantitative limits, qualitative goal setting, and requirements for continuous improvement. This type of regime places an onus on the operator to drive "as low as reasonably practicable" (ALARP) outcomes within the tolerable risk range, resulting in a greater drive to achieve inherent, built-in safety. The GoM tends to rely more heavily on operating procedures and mitigation to manage risk within tolerable limits.
The impact on cost of the different regulatory environment is difficult to assess, as it is embedded into other design decisions. Company codes and standards also vary substantially within each region. Regulation-based cost drivers primarily manifest themselves in hull design, subsea and topsides equipment procurement costs, and topsides segregation for safety.
It is important to note that, in the post-Macondo era, the regulatory environment in the Gulf of Mexico has changed substantially, although the increased regulatory progress has not yet adopted a Safety Case regime. The analysis in this paper does not account for any changes resulting from that incident.
Outcomes
Design choice differences accounted for a 59% cost increase from Case B to Case A, broken down as follows:
SURF design (16.7%). Subsea, umbilical, riser, and flowline (SURF) design (including export system) proved the greatest difference in design approach between Case A and Case B. The GoM design has a substantially lower capex due to less expensive materials selection and simpler, less versatile subsea architecture.
The materials selection was driven by the level of conservatism in temperatures required to initiate unacceptable corrosion levels for a given composition. Case A adopted the more robust choice of corrosion resistant alloys (CRA), whereas Case B judged that carbon steel with a reasonable corrosion allowance and use of chemical inhibition was sufficient to maintain integrity throughout the design life. The cost impact of CRAs is profound, both in procurement and in significantly extending pipelay duration.
Process design (15.0%). Different approaches in topsides process design were a substantial driver of cost. The difference is largely due to the level of conservatism in design and willingness to impact operability and take on risk in order to keep costs low. The key reasons that the Case B process design is cheaper and lighter are:
- Lower calculated MEG requirement for hydrate inhibition in the flowlines due to lower uncertainty margins
- Reduced sparing of key equipment, notably gas compressors with no sparing in Case B, which uses a larger number of small, easier to repair or replace compressors
- Lack of dedicated surge vessels, relying on minimal surge volume allowance in inlet separators
- Pressure rating of inlet system: Case A uses early field-life pressure to reduce compression energy requirements, whereas Case B rates piping and vessels for late field-life pressures, relying on compressors running near full capacity from start-up. Case B requires reducing pressure at the topsides to prevent overpressure in early- to mid-field life.
Commercial assumptions (13.3%). Commercial assumptions, in this context, are the rates and norms used to derive the estimated cost of materials and equipment across the development. Due to the relatively high level cost-estimating in the development planning and concept select phases, it is not feasible to quantify the drivers behind these differences. It is apparent, however, that the engineering estimates for both cases were derived as fairly similar percentages of procurement costs, and that item-specific equipment costs tended to be higher for broadly equivalent items in Case A than Case B, understood to be caused by increased levels of technical specification for custom design, increased vendor quality assurance document obligations, and increased client involvement during tendering, design, and fabrication.
Topsides weight estimation (6.3%). Topsides weight estimates for each case were factored from equipment weights using historically derived regional benchmarks. For a given equipment list, the NWA weight estimate was higher, due to factors that include:
- Lower platform density. Typical overall deck area to equipment footprint revealed ratios of roughly 5:1 in NWA versus 3:1 in the GoM. The difference in footprint is also seen in the weight-to-area ratios, with GoM norms of 1.5 metric tons/sq m much higher than a typical 1.0 metric tons/sq m in NWA. The increased deck area results in more piping, cabling, and structural steel.
- Installation constraints. Topsides installation in the GoM is normally conducted by quayside or offshore heavy-lift cranes/vessels with a current maximum capacity of about 10,000 metric tons, thus driving topsides weight to stay within that limit. Heavy lift at that capacity does not exist in NWA, and floatover installation is the norm for large platforms, with a limit of more than 20,000 metric tons (installed) and more than 30,000 metric tons (planned). The absence of a hard limit reduces incentive to minimize weight growth through design.
- Higher design pressures. NWA design pressure at inlet tends to be higher to better use early field-life pressures, and gas is compressed to a higher pressure for export due to longer distances to end destination. The higher pressures drive up piping and vessel weights.
Hull and mooring design (2.9%). Having accounted for different metocean conditions, a significant difference in hull and mooring design results from the storm design criteria. Case A designed for survival at 10,000-year storm condition, whereas Case B designed for 1,000-year storm condition.
Weight impact on hull design (2.5%). The higher topsides weight of Case A resulted in an associated increase of the hull design steel requirements.
Accommodation (2.3%). The difference in accommodation weight and cost was roughly equally split between the higher estimated number of people on board in Case A, and differences in scope of building content, building standards, and interior finishes.
Observations
The results of this analytical work show that demonstrable relationships can be developed between individual design choices and field facilities TIC. The cumulative effect of many design choices creates significant differences in overall estimated TIC. The major benefit of identifying these differences is to highlight the importance of the relationship between various technical and commercial development requirements and TIC. Understanding these relationships assists the field developer in making the appropriate choices.
Specific learnings that should be considered during feasibility and concept stages for marginal deepwater developments are founded on a principle of "justify in" rather than "justify out" and include:
- Minimize deviation from vendor standard equipment
- Trade sparing of large and expensive equipment for capacity-based multiple smaller units to achieve design capacity
- Assign inlet system design pressure to lowest piping class above end of plateau rate inlet pressure
- Avoid adopting multiple layers of margins (e.g. for estimating MEG requirements)
- Adopt minimal functionality of subsea architecture only
- Critically assess any requirement to deviate from carbon steel for subsea hardware, flowlines, and risers.
Arrangements that reduce the cost of installation vessels should be considered early as these may impact project schedule.
Application of these learnings should result in a development solution that sits somewhere between the two bookended approaches. Design choices suitable for the Gulf of Mexico are unlikely to suit off northwest Australia; however, some modifications in scope and quality will need to be made for projects to become economically viable.
References
Business Council of Australia. (2012). Pipeline or Pipe Dream? Securing Australia's Investment Future.
Deutsche Bank. (2011). Austraia Energy Sector: The Australian LNG Handbook.


