GPU rendering for volume visualization
New capabilities improve accessibility, quality of renderings and accelerate workflow
Philip Neri
Paradigm
The most recent graphic cards offer dazzling computational power and a large graphic memory capacity suitable for handling 3D seismic data. Powerful GPU computing capabilities and large on-board graphic memory capacity support advanced volume interpretation and characterization workflows involving seismic data. This makes it possible to program instantaneous seismic volume rendering as well as on-the-fly seismic attribute calculations. These new capabilities, based on the CUDA programming language, improve the accessibility and visual quality of rendered seismic volumes, as well as accelerating workflows that involve a frequent use of attributes. The benefits for geoscientists are tangible, both in terms of much-increased responsiveness and image quality, and in the access to more effective workflows involving seismic attributes.
3D seismic data benefits from volume visualization technologies in a number of critical interpretation and characterization steps aimed at exploration and production workflows. In the 20 years during which such capabilities have been available, there has been a steady increase in the volumes of data that could be handled (related to the computer's available RAM) and the speed with which the software could change viewing parameters to enhance displays and hone in on specific data characteristics. The speed at which a display refreshes depends on the compute power of the CPU, the throughput of the graphic card, and the internal bus performance and bandwidth available to handle rendering. Moore's law has been correct generally in predicting the improvements over time, from small datasets rendering at slow rates to the current work on 10s of gigabytes of data with display latencies of a few seconds.
Very large gains in performance can be achieved by looking beyond the CPU and bandwidth. Companies in seismic processing and advanced simulation and modeling frequently come up with order-of-magnitude leaps in speed of computation when new architectures are put to use. Well-known examples are the use of computer clusters to accelerate compute-intensive tasks, or parallel input/output systems to dramatically decrease the time needed to get very large data sets from storage disks into a computer.
For visualization, the bottleneck in recent years is the bandwidth of the bus linking the CPU, which performs the rendering of 3D views, to the graphic card that processes the rendered data to create the display. Every change in parameters for a specific rendering requires the whole display to be re-rendered and re-transmitted to the graphic card.
3D graphics cards
Driven by the increasing complexity of, most notably, video games, graphic cards have become a computer within the computer, i.e. a unit capable of taking in data, performing specific computational tasks mostly geared towards simulated reality, and sending the outcome either to a display unit or back to the general-purpose CPU. This makes possible video games that look realistic, manipulating in real time complex textures, detailed illumination, and artificial reality computations such as haze, smoke, waves, etc.
Developers of high-performance computing (HPC) software always look for ways to increase computing speed, reduce the footprint of the hardware (size, electrical consumption, and cooling requirements), and lower the cost of each overall compute cycle. When programming languages became available to tap the resources of the graphic card, the HPC community took note. Currently, these languages are the open standard OpenCL and nVIDIA's proprietary CUDA [Compute Unified Device Architecture]. These languages allow the programmer to execute code on the graphic card as an extension to the resources of the conventional CPU. The graphic card is suited to manage parallelism using the “single instruction multiple data” [SIMD] paradigm. These capabilities are of interest only for tasks that involve extensive recourse to parallel compute processes. GPUs deliver fast results from massive parallelism with smaller power requirements, thus reducing the energy expended per operation.
For HPC, the process entails moving data from the CPU-controlled memory to the graphic card, together with the instructions coded in OpenCL or CUDA. When the process is finished, the results return to CPU memory. While the transit of data to and from the graphic card has some data transfer penalty, the effectiveness of the graphic card to handle specific tasks pays off in terms of overall turnaround. The graphic card acts much like the long-gone floating point units of the 1980s.
With the growing popularity of HPC code using graphics cards, some hardware vendors offer servers that integrate multiple graphic cards, not to drive multiple screens but simply to draw on the speed, cost per operation, and relatively lower power and heat consumption of these devices.
Graphics workstations
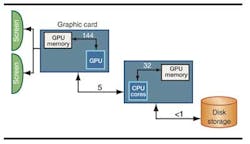
In a typical top-end interpretation workstation using a modern graphics card, it is easy to see that the interface from CPU to GPU is not very fast, typically around 5 GB/s, and therefore constitutes a bottleneck. Also of note are the speeds of the interfaces from GPU cores to display memory currently running at 144 GB/s, whereas the interface from CPU cores to CPU memory is limited to 32 GB/s. Most remarkable is the growth of GPU memory size, from 512 MB or 1 GB to 6GB.
GPU memory was originally for graphics data in 3D visualization and volume rendering. However, for the purpose of 3D seismic manipulation, the increased memory capacity of recent cards makes it possible to allocate greater than 2GB of display memory for actual data and still have room for working buffers to hold compute results and the display buffers themselves. With the seismic data residing within the graphic card, the bottleneck created by the interface between CPU and graphic card is no longer an issue. This alone would result in significantly faster performance.
The considerable processing power on the graphic card further increases the advantage. With graphic cards of more than 400 cores, and a core-to-memory bandwidth more than four times better on a graphic card relative to the computer's native architecture, the difference in performance, responsiveness, and sheer compute power is daunting.
Programmable graphic cards
Operations such as zoom, translate, rotate, or change of color and opacity can be re-rendered exclusively on the GPU with no further transmission of data across the CPU--GPU interface. Only control instructions would need to transit across that interface. This widens the advantage of GPU processing versus CPU processing.
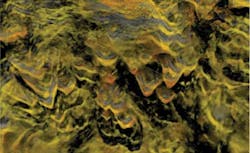
Formations surrounding the Barnett Shale show strong karst-related features.
Beyond the traditional visualization and rendering activities, the massive compute power of the graphical card can have other uses. In the course of seismic interpretation and characterization, geoscientists often use attributes to complement and corroborate features seen on the original amplitude data. These attributes typically are calculated in advance, stored on disk, and called into the computer's memory when needed for visualization. Because the seismic is already in the graphic card's memory, it can be band pass filtered instantaneously using forward and inverse FFTs using onboard cores.
Attributes-on-demand become another powerful enabler for the geoscientist, saving time by avoiding the pre-calculation and making it possible to juggle a number of attributes as workflows demand, with no overhead in storage or compute time.
As is often the case when system performance degrades, users of seismic visualization software are accustomed to compromises to mitigate the slowness of the interface from CPU, where rendering was performed, to graphics card and on to the display screens. This compromises the smoothness of rendered objects, and the degree of detail of the lighting effects that drive the perception of depth and volume in a display. While not a major hindrance in many situations, these compromises affect the quality of work in more complex data settings. With seismic data on the graphic card, and the massive compute resources available to change almost any display parameter and experience a near-instantaneous refresh of the display, the user no longer needs to compromise. He or she can tweak display parameters and choose compute-intensive re-sampling processes, all with no penalty or latency.
High quality volume rendering
An example of higher quality volume rendering can be seen in the image above. It shows the Barnett Shale formation and the formation immediately above and below, both of them carbonates. Karst features penetrate the Barnett from above and reach through to the underlying formation. These areas must be avoided by drillers, since the frac of the shale in proximity of the karst would result in losses and possible leakages. High-quality visualization with a good perception of the 3D nature of these karst features help to plan drilling and exploitation development within the Barnett Shale.
Offshore Articles Archives
View Oil and Gas Articles on PennEnergy.com


