Atlantis project proves viability of OBN in 4D
Micah Reasnor
Gerald Beaudoin
Michael Pfister
Imtiaz Ahmed
Stan Davis
Mark Roberts
John Howie
BP America Inc.
Graham Openshaw
TecPM
Andrew Longo
Clover Global Solutions
The world’s first ocean bottom seismic node-on-node time-lapse (4D) monitor survey was acquired in 2009 at the Atlantis field in the Gulf of Mexico. Field operations went as planned safely and the equipment worked as expected. The combined source and receiver positioning repeatability was achieved to within 30 m (98 ft), second only to permanent installations.
Processing advances made during the project will provide lasting benefits for the static image and achieved best-in-class 4D noise levels. These results show that nodes are suitable for highly repeatable time-lapse seismic programs.
Atlantis sits 150 mi (241 km) into the GoM off the Louisiana coast in the southern Green Canyon area. This prolific trend is home to other large fields such as Mad Dog, Shenzi, K2, Timon, and Neptune. Atlantis began production in October 2007 from Miocene turbidite reservoirs 17,000 ft (5,182 m) below sea level, 7,000 ft (2,134 m) of which is water. The desire for repeatable time-lapse seismic in deepwater combined with the challenges of significant surface and subsea installations made Atlantis ideal for ocean bottom node (OBN) technology.
The baseline survey, acquired in 2005-2006, was the world’s first large-scale deepwater OBS survey to use autonomous nodes (Beaudoin and Ross, 2007). The primary baseline objective was a consistent, high-quality image of the subsalt portion of the reservoir to guide appraisal work. One year after production began, BP put in place a team dedicated to executing the design, acquisition, processing, and interpretation of a time-lapse survey.
Method
The project team consisted of a project manager, seismic interpreters, seismic acquisition specialists, safety management personnel, ROV experts, marine advisors, and seismic processors. The team first set about to design the acquisition and to plan the processing flow.
The baseline survey consisted of 1,628 nodes. However, the producing area of the field only comprised a small portion of the baseline survey image area. The design sub-team decomposed the original survey into individual single shot migrations and then created stacked images of progressively smaller surveys. Extracting coherency and amplitude maps at the reservoir level on each of these sub-images and comparing section views allowed the team to pare the node count down to an optimal 500 nodes. This reduced the node area from 247 sq km (95 sq mi) to 80 sq km (31 sq mi). Analysis of offset contributions to image quality led to a reduction of the minimum far inline offsets from 8 km (5 mi) to 6 km (3¾ mi). These two decisions decreased source area and cost by about 40% compared to the base line survey.
The priority for the processing team after receiving the data would be to QC data. This would need to compare the monitor survey to the base line survey on a shot-by-shot and receiver-by-receiver basis to ensure that the exact same traces were repeated and then carried into the time-lapse imaging flow. To reduce processing cycle time, these processes and their resultant QC displays were automated and tested on real datasets.
Next, the pre-processing flow was developed by incorporating BP’s best practice imaging flows obtained from years of experience in 4D operations elsewhere. These flows were modified to account for the deepwater, partial subsalt nature of the Atlantis project, and then tested by processing the baseline survey through the entire flow.
Later, pre-acquisition field trial data was used as a second test data set, which allowed the team to vet the time-lapse components of the processing flow.
Operations planning was in parallel to the survey design and processing preparations. An initial joint risk assessment meeting with the acquisition contractor, Seabird Exploration, set the stage for a joint effort to prepare the field operations. The preparations spanned several months and included redesigning some of the field equipment, creating new procedures, training, and drafting of detailed operation plans.
The result was a smooth field operation in which the plan was executed as expected, the equipment worked as planned, there was no impact on Atlantis production, and most importantly the project was concluded safely. The operation completed within the planned time frame and 98.8% of nodes returned complete datasets after one month on the seafloor. This node failure rate is on par with results from previous node surveys in the GoM (Smit et al., 2008, Beaudoin and Ross, 2007). This success can be attributed to having the right expertise, taking the time to plan, and the willingness of both parties to learn from each other which resulted in needed changes.
The geophysical challenge in planning a time-lapse survey is accurate repetition of both source and receiver signatures and positions. Autonomous OBS nodes present, at least initially, a greater repeatability challenge for signature. There is great variety amongst the various node systems. The baseline survey node (a Fairfield Z3000) is gravitationally coupled to the seafloor, while the sensor of the monitor survey node (a SeaBird CASE Abyss) is planted into the soil.
Fortunately, the survey design team could rely on the results of two Atlantis sea trials in 2004 (Openshaw and Beaudoin, 2006) that evaluated both styles of autonomous nodes. These results indicated that, within the range of Atlantis soil conditions and within the required seismic bandwidth, both systems would record seismic data of sufficiently similar quality to support a time-lapse monitor survey. Any minor differences could be accommodated in the time-lapse processing flow.
Achieving node position repeatability in the Atlantis area is challenging, with depths ranging from 1,300 m (4,265 ft) to 2,200 m (7,218 ft) in very rugged terrain. Position accuracy was achieved using the Kongsberg HAIN (Hydroacoustic Aided Inertial Navigation) system. This uses USBL (Ultra Short Baseline) positioning but stabilizes the short-term position noise using both an inertial guidance platform and a Doppler Velocity Log. This approach was intended primarily to produce rapid position convergence to allow the ROV to move quickly to a target without jitter, but it also appeared to improve overall positioning.
The long tail of the error distribution is caused by a deliberate choice to favor external sensor coupling over closer geometric repeatability. In a few locations, ROV pilots reported difficulty in fully planting the external sensor. The ROV pilots were given the latitude to search for softer ground within a 20 m (65½ ft) radius of the target location.
The source signature was repeated by designing the monitor survey source array to match the baseline array. However, the team did elect to tow the monitor source array at a depth of 12 m (39 ft) compared to 15 m (49 ft) for the baseline survey to gain higher frequency content. This change did not impact repeatability because there were only minor changes to the frequency spectrum within the range of concern.
The advantage of this design is that a new static image of the extra-salt portion of the field could be made with higher frequency content than the baseline survey, which was designed for a lower frequency subsalt image. Any subsequent time-lapse surveys also could take advantage of this.
As mentioned, the team also changed the minimum offset requirement, reducing it from 8 km to 6 km. To meet this requirement, careful coordination is required between ROV and source vessel during the operation. The source vessel must operate at offset greater than 6 km from the nearest node being placed on the seafloor.
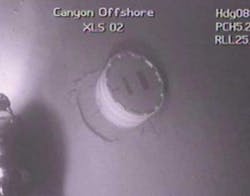
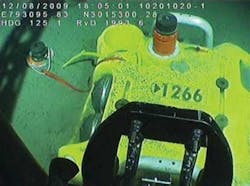
(Above) Baseline survey – node deployed on the Sigsbee Escarpment. (Below) Monitor survey – node deployed 3.4 m from baseline location. White arrow indicates external sensor.
Conversely the ROV cannot remove a node from the seafloor until the source moves off by that minimum offset. In processing, offsets greater than 6 km were removed from the baseline survey.
To achieve source positioning accuracy during acquisition, the starboard gun array was steered to match the baseline shot positions achieving a high percentage of shots within 10 m (33 ft) of the baseline positions. Inclusion of the un-steered port shots gives a maximum source position error of 25 m (82 ft) despite considerable loop current activity.
The combined source and receiver repeatability is on the order of 30 m (98 ft). This remarkable geometric repeatability, approaching that of permanent arrays, provides a new option for acquiring highly repeatable time-lapse surveys in producing fields.
The final shipment of node data arrived in BP’s Houston seismic processing center one week following acquisition. The team began to implement the planned flow and produced an initial image within just seven weeks. However, the initial images exhibited a high degree of time-lapse noise which is observable in the overburden section of the monitor minus base difference section. This noise is caused by variability in the spectrum due to local seabed conditions, subsalt-generated noise, and subtle velocity errors causing non-flat gathers. The team began to reduce this noise through a series of small experiments. The first experiment revisited the spectrum matching filters. In the initial flow a single, global filter was chosen by analyzing the near offset direct arrivals.
An alternative method was tested in which a matching filter was derived for each node and the filter window was lengthened to capture lower frequencies. This proved superior.
Second, the subsalt noise was addressed. A salt transmission attenuating migration was created which attenuated any energy passing through the salt body which encroaches from the north in the overburden. The producing area image primarily is extra-salt so this had no negative impact on the target image but did remove the subsalt-generated noise.
A final experiment enhanced the structural image. Post migration common image gathers were created from the wave equation migration. A trim statics approach flattened the gathers before stacking. This had a significant impact on amplitude fidelity, image quality, and matching between base and monitor. The result of this new processing flow can be seen by comparing the original monitor minus base difference section to the new difference section. Time-lapse noise measurements taken within the overburden, in terms of the Calibrated Difference in Reflectivity (CDR, Dyce et al., 2004), are among the lowest in BP’s experience, even compared to permanent installation surveys.
A disciplined project management team, focused on risk identification and mitigation, and with broad technical expertise allowed BP to successfully acquire of the world’s first node-on-node time-lapse survey. This project has demonstrated that ROV-deployed nodes can reliably conduct highly repeatable 4D surveys. Node reliability approached 99%, and over 90% of nodes were delivered to within 5 m (16 ft) of seafloor locations that had been occupied over three years before. Source repeatability was achieved to within 25 m (82 ft). Final time-lapse images yielded a CDR noise level measurement among the best in the BP portfolio. This success marks the addition of another tool to BP’s growing portfolio of surveillance technologies.
Acknowledgments
The authors thank BP and BHP Billiton for permission to publish this article and for their support of the project. Collaboration with the onshore and offshore staff of SeaBird Exploration contributed to the success of this first node-on-node, time-lapse survey. In addition to the authors, team members included Georgiy Astvatsaturov, Jeff Collins, Jonathan Davis, William Davison, Ray Harrison, Michael Mervin, Randy Read, Scot Rudolph, Werner Schueller, Kenny Gullette, and Hans Sugianto. Based on a paper presented at the SEG 2010 Conference held Oct. 2-5, in Keystone, Colorado.


