Risk assessment in offshore standards with new metocean criteria
Peter Marshall, Moonshine Hill Proprietary
New Gulf of Mexico metocean criteria are being implemented in API interim bulletins and MMS emergency regulations. Design wave heights in the central “hot spot” region are being increased by up to 30%, and forces by up to 60%. For newbuilds, these increases make economic sense. However, Bulletin-EX applies these same increases to the reassessment of critical A-1 infrastructure hubs.
The next level of assessment is A-2, human safety in sudden storms, for which storm risks often exceed the economic optimum. In the gap between A-1 and A-2 there is room for an intermediate level of cost-risk assessment, in which the benefits of risk reduction are compared to the cost of upgrades.
Some background
Early fixed offshore platform designs were tested by hurricanes, blowouts, fires, and collisions. Reasonably good performance was obtained from designs to 100-year criteria of the day, with structural redundancy of eight or more piles, open decks of one or two levels, and rudimentary attempts at joint reinforcement. By the late 1960s, this technology was extended to over 100 m (300 ft) water depth.
There was a lot of learning things the hard way. Offshore pioneers had a revolutionary spirit, and many were former military officers who knew how to take risks and deal with setbacks. But the 1960s were also a time when most of the basic research was done on wave forces, ice loads, laterally loaded piles, and tubular joints.
Human factors play a big role in technological disasters, from outer space to something as mundane as the failed levees at New Orleans. What happens when a service contractor goes to lunch and forgets to close the master valve on a live well? At Bay Marchand, Louisiana, several men were killed in the initial explosion and the rest got off safely, albeit some with severe burns.
LESSON: The safety devices of the day – storm chokes – stayed open at normal production rates. We now use sub-surface, surface controlled safety valves (SSSCSVs) which fail shut.
Good crisis management helped. Most of the oil was allowed to burn. “Too precious to waste” was not yet a slogan. Skimmer booms collected much of the rest. Red Adair and his firefighting barge provided drama, while rigs drilled relief wells to intersect the burning ones and pump them full of cement.
Lessons from storm damage
The offshore industry recently got a wake-up call from hurricanes Ivan, Katrina, and Rita (2004-05), in which 130 of 4,000 fixed platforms were lost. Hurricanes Hilda (1964), Betsy (1965), and Camille (1969) were the “terrible trio” in the ’60s in which 50 of 1,500 platforms were lost.
Some of the early platforms simply disintegrated, leaving holes in jacket legs where the braces pulled out plugs. Research showed very high shell bending stresses at the “hot spot” adjacent to the connecting weld. Failures were easier to explain than sister platforms that survived. Testing showed a surprising amount of reserve strength after first yielding at the hot spot.
The 1967 world record SP 62 platform applied the new joint design criteria, and saw 80-ft (24-m) waves in Hurricane Camille two years later. The previous 100-year design wave was only 57 ft (17 m). Green water caused considerable damage to deck equipment. Camille was a watershed event, stimulating a new round of research.
LESSON: The old design wave was too low. The 100-year event for anywhere in the entire northwest GoM was found to be 85 ft (26 m). For a typical platform site in this region, the 100-year wave was found to be 75 ft (26 m). This increase was a hard sell. Eventually, in the 9th-19th editions, API RP 2A showed a reference level wave height of 70 ft (21 m), with a guideline range of 58 ft (18 m) to 84 ft (26 m), and shoaling curves extending back into shallow water. This defined the “modern era” of platform design.
Yet the SP 62 supporting structure stood, undamaged, until Ivan and Katrina. Ultimate collapse analysis and survival/failure experience both showed a median load at failure of at least twice the design load.
LESSON: Offshore platforms have considerable reserve strength, with plastic load redistribution giving about 40% more capacity than is accounted for by safety factors and known sources of bias. Today’s pushover analyses account for plastic load redistribution, but still show 10% to 15% bias on the safe side unaccounted for. Calibrated platform fragility curves and cost/risk economics were used to justify the criteria increase, to the API reference level used in 9th-19th editions of RP 2A.
Fatigue
Some of the early field failures appeared to be by progressive tearing, with lots of deformation, leading to an interest in low-cycle fatigue. Southwest Research Institute investigated similar problems of plastic fatigue in pressure vessels. Fatigue cracking and ultimate failure was correlated with “hot spot” strain gages adjacent to the weld toes. These gages measure local shell bending and membranes stresses, but not the notch effect of the weld itself. Post-mortem sectioning showed the connections to be tolerant of weld root defects, and subsequent finite element analysis showed the highest local strains to be on the outside surface. The hot-spot S-N curve was incorporated into AWS D1.1-1972, and relaxed reject criteria for the weld root in tubular connections were incorporated into UT (ultrasonic testing) standards, e.g. API RP 2X.
Prior to the adoption of RP 2X, a new offshore platform was condemned because underwater UT found “cracks” at the weld root. This legendary SIM fiasco provided full size specimens for fatigue testing at the University of California. External weld profiles merged smoothly with the adjoining base metal, so fatigue tests gave excellent results.
American fatigue criteria enabled the initial push into deeper water and harsher environments. By the time the more exhaustive European fatigue research was concluded in 1987, the first offshore boom was over.
Dynamics and fatigue governed the design of the North Sea Brent A platform and the 1,000-ft (300-m) Cognac platform in 1974. Although Cognac survived a direct hit by Hurricane Katrina in 2005, with damage to equipment by wave-in-deck, its viability is called into question due to subsidence.
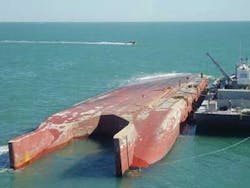
For Brent and Cognac, regulations and construction methods were finalized during construction, resulting in cost overruns. For Bullwinkle, at Green Canyon block 65, the engineers had learned their lesson, and no steel was cut until all the engineering was done. The resulting project, with no changes, was faster than most “fast track” fiascos. Bullwinkle was the last of its kind, installed at Green Canyon block 65 in 1988, and still holds the fixed-base water depth record at 1,350 ft (400 m). Its one-piece jacket weighed 50,000 tons (45,000 metric tons), and was transported and launched by a purpose-build 850-ft (259-m) barge. Bullwinkle still is making money as a processing and transportation hub for nearby subsea fields.
Cost-risk tradeoffs were reexamined in 1987 to calibrate new random directional wave force (RDWF) technology. Consequence-based design criteria in the 21st edition of RP 2A reaffirmed the use of 9th-19th force levels for L-2 ordinary platforms, but required updated 100-year design forces for L-1 critical facilities and deepwater platforms. Reassessment rules gave some slack for existing structures, recognizing the different economics of upgrading in-place versus newbuild.
More recent lessons
No lives were lost during Ivan, Katrina, or Rita due to the industry’s personnel evacuation policy. However, some workers have been killed and injured during clean-up.
There was minimal pollution, due to the use of SCSSSV. However, there were subsequent spills due to tankers running into the wreckage of toppled platforms. No L-1 platforms, designed to the full 100-year criteria of the 20th and 21st editions of API RP 2A failed, and only 2% of platforms designed to the lower L-2 criteria (9th-19th editions) were lost. Most of the failures were among old “stripper” platforms designed to earlier, still lower criteria, and having an average age of nearly 40 years.
The biggest economic impact was caused by production shutdowns due to topside facilities damage on offshore platforms, to the pipelines linking them to shore, and to coastal processing facilities. Onshore devastation to people and infrastructure slowed the recovery. All this caused a sharp and sustained rise in energy prices, which got the attention of the public, the press, and the government.
Just when we think we know it all
One of the more surprising platform survivals was the 1965 vintage MP 290, designed for 57-ft (17-m) maximum wave height and having only 41.5-ft (12.6-m) deck clearance. A 1982 pushover analysis indicated its ultimate strength load factor was less than unity for Hurricane Frederick, which it survived with no damage. However, waves from Ivan were much larger, and overwhelmed the deck – yet the structure did not collapse.
Software for ultimate strength pushover analysis also is calibrated on destructive tubular frame tests. Such confirmatory tests can surprise. Plastic hinges in compact sections do not yield forever, but eventually form local buckles that fracture under subsequent cycling. Struts lose capacity suddenly after reaching their column buckling load, but even a small amount of plasticity can be beneficial in load redistribution.
Time-based deterioration should not be neglected in examining the failure of old platforms. Data from a 1966 survey of splash zone members in a large fleet of well jackets in the GoM might be useful in the absence of detailed thickness measurements. One platform failed while manned in 1984’s sudden Hurricane Juan, due to extensive “lace curtain” corrosion below water. Fortunately, its condition was known, survival suits were provided, and the men survived.
The evolution of fixed platform design criteria in API RP 2A can be traced in the parallel histories of hurricanes, design standards, and related technology developments. There is a clear legacy of lessons learned. Many pre-RP 2A platforms suffered from weak joints, poor steel ductility, underestimated wave conditions, and high assumed risks (from using 25-year design criteria). However, without managers willing to take risks and proceed with limited knowledge, the offshore oil industry might never have started.
During the early RP 2A period, there were lessons from Hilda, Betsy, and Camille – and basic research was done on storm hindcasting, wave forces, laterally loaded piles, tubular joints, fatigue and fracture, and RP 2A was updated annually. The “modern RP 2A era” began with the 9th edition, and the “new era” is what we will have after the lessons of recent storms are digested.
Fixed platforms show a steady decline in recent mortality as we progress through their evolutionary periods. No post-20th edition L-1s failed, although their suddenly outdated 100-year design criteria was exceeded in many cases. Caissons are designed to be overwhelmed by waves, and did surprisingly well.
Some 120 platforms failed after experiencing wave-in-deck, yet 80 survived such events. Using hindcast storm conditions and pushover analysis for each studied platform, both survivals and failures are used to perform Bayesian updating of the prior estimate of platform fragility. With remarkable survivals, uncertainty is narrowed and the distribution is shifted to the right, indicating bias on the safe side. When calibrations from several storms (Andrew through Ivan) are combined, they show a bias of about 10% on the safe side – more if actual wave-in-deck events are considered.
Applying this calibration to the example of a platform for which push-over ultimate capacity is only 85% of the new Central 50-year loading, yields an average annual risk rate (AARR) of 1.9% to 3.2%. For A-2 platforms just barely passing the sudden storm safety check, exposure to the full hurricane population of the Central region yields AARR estimates of 6% to 13%. Actuarial failure rates for L2s and A-2s in 2004 and 2005 ranged from 2.1% to 7.7%, depending on age. Many of the affected platforms were stronger than the A-2 minimum by an unknown amount, but this useful information was not available.
Wind conditions specified for combination with waves for global platform analysis understate the local extremes for topside elements. While vessel motions always have been accounted for in designing derricks and substructures on drillships and semisubmersibles, this was overlooked for rigs on compliant platforms, which nominally remain level, despite dynamic lateral accelerations comparable to earthquakes. Friction tie-down clamps proved unreliable. Dry friction was assumed for skids that might get greasy. Uplift loads nominally balanced by gravity will increase disproportionately when the design overturning load is exceeded. Bolt re-tensioning may be neglected in the rush to evacuate before a storm. Under-design or neglect of such a small element can have huge consequences, asMars showed.
Recent storms drove home the importance of subsidence in exacerbating the wave-in-deck problem. Some prolific fields have subsided as much 12 ft (3.7 m). In addition, the Central Gulf region also experiences slow regional subsidence due to a huge load of recently deposited Mississippi River sediments.
Wave-in deck
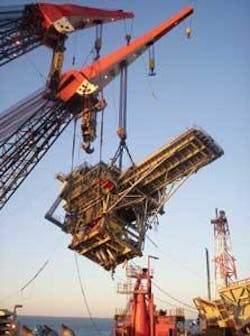
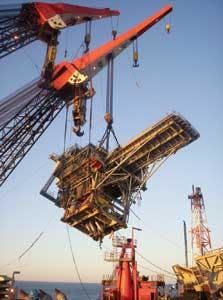
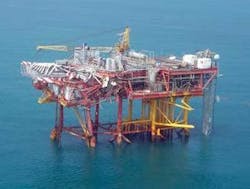
The new Central Gulf metocean criteria raise recommended deck heights as much as 24 ft (7.3 m). A potentially contentious issue will be dealing with existing platforms with low decks. During Katrina, the SP8X Mystery platform suffered extensive topside equipment damage from a 68.5-ft (21-m) wave crest, with 16 ft (5 m) of green water impacting the deck. However, the damage was largely confined to a 90-ft (27-m) section of the 160-ft (49-m) long structure, indicating that this was a 3D short-crested wave, rather than a 2D long-crested one like what is used for design checks. There was minor damage to the deck structure, but none to the supporting jacket structure.
The observed crest elevation is itself remarkable and instructive. It represents the one-sigma extreme of Forristall’s area-based estimate of extreme crests, which is in turn larger then the traditional point estimate used with design waves.
LESSON: Areas within 15% of the traditional crest elevation should expect to get wet, and be designed for local wave impact. The peak dynamic wave pressure of the 3D wave occurs over a very small area, and not all the way across the deck. At lower elevations, the pressures also taper off laterally, and jackup rig designers find it advantageous to account for this. Together, these effects can account for a three- to five-fold reduction in applied load. The boarding wave can be treated as an impulse-momentum event with a short time duration, further decreasing the effect on dynamic base shear in the jacket by a factor of up to two.
Lateral load capacity at damage to a deck brace on the SP8X allows this to be used as a full-scale wave-in deck experiment. Extremes of applied load are represented by Wheeler-stretched NU wave at the nominal hindcast crest elevation, and a higher nonlinear Chappelear wave at the observed crest.
LESSONS: For traditional static wave force calculation of global jacket loads, it is not unreasonable to ignore local crests above the nominal estimate. For local equipment hardening, local wave forces in the 15% + 5 ft (1.5 m) zone should be considered, and may be used with caution to assess the deck structure. Formal protocols for this are being debated. However, to use a very steep 2D nonlinear wave matching the local extreme crest elevation would be extreme, and is not recommended.
The HEAT is on
After Ivan, Katrina, and Rita, the API Hurricane Evaluation and Assessment Team (HEAT) was organized in fall 2005. Three new API Interim standards – 2INT-MET (metocean), 2INT-DG (new-build design guide), and 2INT-EX (reassessment for existing) –were rolled out at API workshops in July 2007.
A bitter pill is the recognition of a “hurricane alley” or “hot spot” in the Central Gulf region, attested by Camille, Opel, Ivan, and Katrina. Storms get energized as they pass over the warm water loop current. Design and reassessment criteria remain unchanged for most of the remaining GoM.
Bulletin 2INT-MET was developed over 18 months by the standing API Metocean task force, working with HEAT. The old nine-site hindcast used a parametric model for the moving wind field, requiring only central pressure, max-wind radius, and storm path from the historical database. Although a central “hurricane alley” might have been plausible in retrospect, Monte Carlo studies indicated that such variations were explainable as randomness. The new 1,400-gridpoint spectral hindcasts use more detailed data from aircraft and satellite observation. Data pooling and a physical model more clearly support the central “hot spot” results. Overall, the old and new studies are remarkably consistent, although they differ in such details as Gulf-wide averaging versus regional pooling.
Other HEAT work groups mined data from recent storms, calibrating platform fragility and analysis biases against survivals and failures, re-examining recipes for wave-in-deck loading and equipment tie-downs, and disseminating the results. Although the work continued through the end of 2007, results indicate no glaring shortcomings in the underlying technology. Most of the 120-plus platforms that failed should have. Explaining the survival of 80-plus that got green water in their decks is more interesting. Greater economic disruption was caused by distressed topsides and other infrastructure damage than by the collapse of old stripper platforms.
Bulletins 2INT-DG and 2INT-EX were developed over an intensive three-month period by task groups of API Subcommittee 2, Offshore Structures, which had considerable membership overlap with HEAT. The Design Guide combined new metocean conditions with existing recipes for wave kinematics, force coefficients, structural capacity, and safety factors for fixed and floating platforms. It was assumed that this would achieve consistent risk levels. Feasibility and cost impact of this “new era” criteria deserves continuing scrutiny.
Platform reassessment
Bulletin 2INT-EX was more difficult. While fixed platforms had a rationale for reassessment in Section 17 of RP 2A, TLPs and other deepwater floaters did not. In the Central region, forces for ultimate strength assessment of economically important A-1 platforms will increase by 60%, keeping the average annual risk rate low, about 0.25%. Manned evacuated A-2 platforms will be assessed for the 100-year sudden storm in which people might get caught offshore. However, the AARR when exposed to the full hurricane population is about 5% in the Central region and 2% elsewhere. Some would regard these numbers as controversial, and higher than the economic optimum. Commentary encourages rational cost versus risk assessment in the A-1 to A-2 gap, which will be a focus of ongoing research.
While research continues, MMS has implemented the interim API bulletins. Deepwater platforms and critical infrastructure hubs are being assessed to stringent new A-1 criteria.
Peter Marshall can be contacted at [email protected].
For your copy:
API Bulletin 2INT-EX, Interim Guidance for Assessment of Existing Offshore Structures for Hurricane Conditions, provides updated guidance for the use of hurricane metocean conditions in the Gulf of Mexico, particularly in the Central Region and its adjoining transitions. For more information or to obtain a copy of API Bull 2INT-EX visit API atwww.api.org/cat.