Adepelumi, A.A, Falebita, D.E - Geology Department, Obafemi Awolowo University, Ile-Ife
The recent explosion of activity in controlled source electromagnetic (CSEM) exploration in offshore West Africa has shown theoretically and in practice that CSEM is a viable and cost-effective oil exploration technique. When integrated with other geoscience information, primarily seismic data, CSEM shows promise for adding value in upstream applications.
The outcomes and analysis of modeling with CSEM produce a more robust and in-depth understanding of the prospect. It shows the importance of incorporating geologic information into the modeling exercise. The result also can provide direct evidence of hydrocarbon. CSEM can detect thin hydrocarbon-bearing layers at certain source-receiver configurations, and in certain source-frequency ranges. In addition, the so-called “split effect” that is diagnostic of buried resistive layers can be verified by one-dimensional (1D) modeling. The results are significant because residual gas cannot be detected using seismic surveys and geologic consideration only.

1D modeling of marine CSEM data shows that this technology may be the most important geophysical technology for seafloor imaging since 3D reflection seismology. However, CSEM modeling results should not be taken as absolute truth for hydrocarbon detection since many geologic facies such as evaporites, volcanics, cemented and/or freshwater sands, and tight carbonates often exhibit enhanced electrical resistivity relative to their surroundings, but contain no hydrocarbons. Integration of CSEM result with well logs and 3D seismic data is needed to confirm any prospect in the deep offshore environment.
The effect of the thin resistive layer increases with increasing frequency, and the range at which the maximum effect is seen decreases. However, as the frequency increases, the magnitude of the field measured at a given distance from the source decreases. If the frequency is increased too far, the signal falls below the noise level and cannot be detected in practical surveys. Modeling is needed before the survey to optimize survey parameters for the target. The use of predictive modeling improves the pre-drilling CSEM prediction, and also provides information on the presence and lateral extent of the hydrocarbon reservoir.
This method has been in development for more than two decades. Only recently has the successful implementation of this technology for hydrocarbon exploration been reported. To date, more than 250 marine CSEM surveys have been acquired worldwide by industry since late 2000 when the first test was conducted offshore Angola by Statoil. The pre-drill prediction success rates reportedly are high throughout the industry.
Sub-seafloor resistivity data has, in the past, been obtained almost exclusively by wireline logging of wells. However, there are clear advantages to non-invasive ways to provide such information. While not comparable to wireline logging vertical resolution, the saving by not drilling test wells into structures that do not contain economically recoverable amounts of hydrocarbon represent a major economic advantage.
Use of 1D CSEM modeling to discover reservoirs and to predict fluid type in prospects offshore Niger Delta, Nigeria, used the newly developed finite element algorithm from the Scripps Institute of Oceanography. Two models were considered. Model 1 comprises of 50 Ohm-m, 50-m (164-ft) thick layer (representing a hydrocarbon bearing reservoir), embedded at a depth of 1,050 m (3,445 ft) below the seafloor in a 1 Ohm-m half-space. The model is overlain by 1,000 m (3,281 ft) of seawater. The sources are 0.1 Hz, 0.5 Hz, 2.5 Hz, and 10 Hz HED at the seafloor. Model 2 was defined to have 100 Ohm-m, 100-m (328-ft) thick layer (representing a hydrocarbon bearing reservoir), embedded 550 m (1,804 ft) below the seafloor in a 1 Ohm-m half-space. The seawater layer and the HED sources are the same as Model 1. The corresponding electric field strength as a function of range for the in-line and broadside geometries was calculated for each model and used to identify the potential hydrocarbon zone and the limit of the reservoirs. The effect of airwave and the split that is diagnostic of buried resistive layers was verified through modeling.
Model results
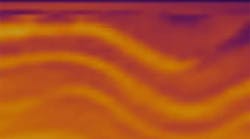
The 1D model results (that is, the electric field strength as a function of range for the in-line and broadside geometries) in this study were of radial mode fields. In one run, the HED source frequencies were 0.1, 0.5, 2.5, and 10 Hz. The expected responses for oil-filled reservoirs were calculated from the model using a 1D finite-difference frequency domain FORTRAN. The maximum amplitude is clipped by the limited dynamic range of the receiver, and was modeled in a similar way.
The effect of transmission frequency on the response of a 1D model containing a thin resistive layer is that the effect of the thin resistive layer increases with increasing frequency, and the range at which the maximum effect is seen decreases. However, as the frequency increases the magnitude of the field measured at a given distance from the source decreases. If the frequency is increased too far, the signal falls below the noise level and can no longer be detected. Careful modeling is needed prior to a survey in order to optimize the survey parameters.
The effects of the airwave caused by fields traveling up through the water, through the air, and back to seafloor start to dominate the half-space response at a range of approximately 3 km (2 mi) from the source. The in-line (0° azimuth) response shows increased amplitude caused by the hydrocarbon layer. The effect on the broadside response is smaller. While the amplitude of the in-line component is increased by more than an order of magnitude, the effect on the broadside response is minimal. The airwave component contains no information about the sub-seafloor resistivity, and tends to dominate the received signal in shallow water and at long source receiver offsets. The effect of the airwave on the amplitude of the electric field computed where the break in slope on the plot of electric field as a function of range to a distinctly shallower gradient indicates the emergence of the airwave as the dominant signal at the receiver. This occurs at about 2.5 to 5 km (1.5 to 3 mi) range in the responses for a 1 Ohm-m half-space. Also, the range at which the airwave dominates the response, and information on seabed resistivity is lost, increases with decreasing frequency. The effect of the airwave can therefore be minimized by choosing appropriate transmission frequencies and by targeting surveys on prospects in deepwater and in which the target is at a relatively shallow depth below the seabed.
The in-line geometry contributes to the observed field at the seafloor by the vertical component of current flow. The broadside geometry results in fields at the seafloor which are more dependent on the contribution of inductively coupled currents flowing in horizontal planes. As a result, the presence of the thin resistive reservoir layer produces a significant increase in the in-line fields, while having virtually no effect on the broadside fields.
Splitting amplitudes between the two modes is observed in the model results. In this model the resistivity first increases and then decreases with depth. The signal amplitude varies by several orders of magnitude over the useful set of source-receiver offsets.
In addition, due to the distinct difference in the magnitude of the response of both the in-line and broadside mode results, the effect of the presence of the hydrocarbon layer is evident by this difference. At short ranges, the response is only sensitive to the overburden, and therefore the difference between it and the half-space response (for both in-line and broadside geometries) is small. At ranges of 2.5 to 5 km (1.5 to 3 mi), the amplitude of the in-line response is increased by more than an order of magnitude relative to the model with no hydrocarbon layer.
In contrast, the broadside response is only marginally altered.
At long range, the effect of the airwave in the half-space response causes the magnitude of the normalized fields to fall again. The lack of sensitivity in the broadside response to the presence of thin resistive layers might argue in favor of survey geometries that concentrate on the collection of in-line data. However, in order to resolve the presence of hydrocarbon layers unambiguously, both in-line and broadside data are important and should collected simultaneously. Moreover, the increased return signal of the in-line fields is possibly due to reflection and refraction of EM energy by the high resistivity hydrocarbon accumulation. Generally, the 2.5 and 10 Hz data are above the instrumental noise floor to a 2.5 km (1.6 mi) range. However, the 2.5 and 10 Hz electric fields are stronger when the transmitter is 4 to 8 km (2.5 to 5 mi) west of the receiver, indicative of a subsurface resistive feature.
The most plausible explanation for the dominant behavior of the in-line field was that if the survey generates significant vertical components of electric current flow in the overburden layer, then galvanic effects along the current path will be affected strongly by even a thin resistive hydrocarbon layer. For the galvanic case, the magnetic field will be polarized transverse to the resistive hydrocarbon layer. This is transverse magnetic (TM) mode. In TM mode the electric field enters the resistive hydrocarbon layer under a critical angle and propagates along the layer. Due to lower conductivity than in the surrounding sediments the E-field will be attenuated less and be guided along the layer. EM energy constantly leaks from the layer and back to the seafloor. Guiding the electric fields will alter the overall current flow pattern in the overburden.

In contrast, if the current at the base of the overburden dominantly is horizontal, inductive effects dominate the coupling between this layer and the deeper layers. Then the E-fields are transverse to the resistive layer, TE-mode. In TE modem E-fields will be reflected only from the layer, and the reflected energy will die off as a function of offset. At a certain offset the E-fields or the currents from the in-line configuration will dominate the energy contribution at the seafloor.
This modeling exercise demonstrates that by careful positioning of both transmitter tow tracks and receivers relative to a suspected hydrocarbon bearing structure, CSEM surveying can provide detailed information on the lateral extent of the hydrocarbon, as well as on its existence or otherwise.
How CSEM works
CSEM has been proven to be the most effective data-acquisition technique for detecting electrically resistive horizontal or subhorizontal layers, such as hydrocarbon-saturated clastic rocks buried beneath a conductive seafloor. The basis of the approach is the use of a mobile horizontal electric dipole (HED) source and an array of seafloor electric field receivers. The transmitting dipole emits a low frequency (typically a few tenths to a few tens of Hz) electromagnetic signal that diffuses outwards both into the overlying water column and downwards into the seabed. Such low frequencies are required to provide adequate signal penetration to several kilometers below the seafloor. In addition to the controlled-source signals, the seafloor instruments record the earth’s response to natural electromagnetic sources. The rate of decay in amplitude and the phase shift of the signal are controlled both by geometric and by skin depth effects.

Because in general the seabed is more resistive than seawater, skin depths in the seabed are longer. As a result, electric fields measured at the seafloor by a receiving dipole at a suitable horizontal range are dominated by the components of the source fields that have followed diffusion paths through the seabed. Both the amplitude and the phase of the received signal depend on the resistivity structure beneath the seabed. A survey consisting of many transmitter and receiver locations can therefore be used to determine a multidimensional model of sub-seafloor resistivity. For CSEM data acquisition, both the in-line and broadside geometries are commonly used. Source-receiver geometry is expressed in terms of the azimuth, defined as the angle between the axis of the source dipole and the line joining the source and receiver. Two extreme geometries can be considered: At an azimuth of 0° (the in-line geometry), the fields are purely radial (parallel to the line joining the source and receiver) and the galvanic effects are much stronger. In the orthogonal direction (broadside geometry), the fields are purely azimuthal, the inductive effects dominates and the observed response can in general be explained in terms of attenuative effects governed by electromagnetic skin. Also, with the in-line antenna configuration the transmitted electric field enters the high resistive hydrocarbon layer under a critical angle and is guided along the layer. Electromagnetic signals constantly leak from the layer and back to the seafloor. The guiding of the electric fields significantly alters the overall pattern of current flow in the overburden layer. A broad-line antenna configuration does not generate guided waves, and thus the two antenna configurations have different sensitivity to thin buried resistive layers. •
Editor’s Note: From a paper given at the Offshore West Africa Conference in Abuja, Nigeria, this year.
Acknowledgements
The author thanks Total Petroleum, Nigeria for the sponsorship and Scripps Institute for use of the CSEM code.
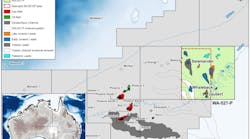
Niger Delta geology
The Niger Delta petroleum system consists of the Tertiary Akata-Agbada formation. The delta formed at the site of a rift triple junction related to the opening of the southern Atlantic starting in the Late Jurassic and continuing into the Cretaceous. The delta proper began to develop in the Eocene, accumulating sediments that now are over 10 km (6 mi) thick. The primary source rock is the upper Akata formation, the marine shale facies of the delta, with possible contribution from interbedded marine shale of the lowermost Agbada.

Oil is produced from sandstone facies within the Agbada. Turbidite sand in the upper Akata formation is a potential deepwater target.
The Niger Delta is in the Gulf of Guinea and extends throughout the Niger Delta province. From the Eocene to the present, the delta has prograded southwestward, forming depobelts that represent the most active portion of the delta at each stage of its development.
These depobelts form one of the largest regressive deltas in the world with an area of some 300,000 sq km (115,831 sq mi), a sediment volume of 500,000 cu km (120,000 cu mi), and a sediment thickness of over 10 km (6 mi) in the basin depocenter.
The Tertiary Niger Delta is divided into three formations representing prograding depositional facies distinguished mostly on the basis of sand-shale ratios. The type sections of these formations are described in Short and Stäuble. The Akata formation at the base of the delta is of marine origin and is composed of thick shale sequences (potential source rock), turbidite sand (potential reservoirs in deepwater), and minor amounts of clay and silt. Beginning in the Paleocene and through the Recent, the Akata formation formed during low stands when terrestrial organic matter and clays were transported to deepwater areas characterized by low energy conditions and oxygen deficiency. The formation underlies the entire delta.
Deposition of the overlying Agbada began in the Eocene and continues into the Recent. The formation consists of paralic siliciclastics over 3,700 m (12,139 ft) thick and represents the actual deltaic portion of the sequence. The clastics accumulated in delta-front, delta-topset, and fluvio-deltaic environments. In the lower Agbada, shale and sandstone beds were deposited in equal proportions. The upper portion is mostly sand with minor shale interbeds. The Agbada is overlain by the third formation, the Benin formation, a continental latest Eocene to Recent deposit of alluvial and upper coastal plain sands that are up to 2,000 m (6,562 ft) thick.
Most known Niger Delta traps are structural, although stratigraphic traps are not uncommon. The structural traps developed during synsedimentary deformation of the Agbada paralic sequence.