Wellbore stability analysis using wireline borehole images is well established. Today, high-resolution logging-while-drilling (LWD) images are available, and they offer information in real time, as well as the opportunity to acquire time-lapse information through re-logging while tripping.
Drilling practices continually push well design boundaries in the areas of extended reach drilling, high pressure, and geometrically complex well design. These scenarios require increasingly sophisticated wellbore stability management. With the real-time information within the while-drilling high-resolution images, a method has been developed for real-time incorporation in to well bore stability management that will reduce risks in these challenging well conditions.
Understanding application differences
Wireline data, geophysical information, and offset well data are used to define a pre-well earth model. A wireline image measurement of the borehole often yields information on the near-wellbore stress regime. While such measurements are useful, by nature the well has already been safely drilled. Casing strategy and mud weight schedules based on the pre-well model are hence most often locked into a drilling program.
The well bore integrity challenge until now has been that geomechanical modeling work is carried out up front and is rarely usefully updated up in real time, where the greatest chance of failure is during the drilling execution phase. In addition, real-time pore pressure prediction techniques based on acoustic data, resistivity data, and mud logging data help to refine the pre-drill model but still do not define the wellbore stress mechanism.
High resolution real-time LWD measurements can influence current and future drilling activity through indicating this stress mechanism helping to calibrate the field and pre-well stress model on the fly. Dynamic events such as induced fractures and well-threatening instability are detected by these LWD images.
Understanding of the differences between the application of while-drilling (LWD) and wireline imaging measurements allows us to use both appropriately where we see good use for LWD images in the real-time domain and wireline images in the pre-well modeling domain.
Comparing LWD and wireline logging
There are three fundamental differences between LWD and wireline electrical image logs:
- Time of acquisition: Wireline logs are usually acquired 2-10 days after drilling, whereas LWD logs are acquired minutes to hours after drilling. With increasing time, filtercake build-up and invasion increase as do the likelihood and potential severity of breakout and other types of wall damage. In addition, induced fracture aperture will not be at a maximum and is likely to be masked by filtercake or annealing. LWD data can be acquired again on tripping out of hole, up to a few days later, in which case the borehole environment may be closer to that of wireline
- Physical environment: Image acquisition on a dynamic platform (e.g. rotating) is subject to vibration with dynamic pressure and temperature changes, whereas wireline images are acquired at equilibrium with a static fluid column and tool motion determined largely by the logger. Despite the dynamic environment LWD records the borehole in its most pristine condition (before deterioration and mud invasion)
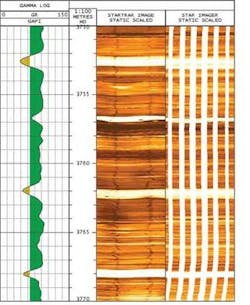
- Type of measurement: Wireline logs from an offset well can have a complete suite of measurements for a post-well geomechanical study, which forms the basis of a pre-well stability model. As wireline measurements have been available for longer than while-drilling analogues the assumptions, limitations and response sensitivities are often better understood and integrated into processing workflows. Wireline electrical image logs are made using a series of buttons on pads pressed onto the borehole wall, providing high resolution but only partial borehole coverage. Conversely, LWD electrical images use drillstring rotation to scan the borehole wall using a single sensor providing full borehole coverage and the ability to interpret non-sinusoidal and discontinuous features on the borehole wall.
null
Well V sedimentological and geomechanical characteristics
Data was used from a vertical well that was logged with high-resolution LWD, wireline electrical imaging tools, and a range of other wireline measurements (including acoustic). The well was set in an extensional basin of the North Sea and penetrates Jurassic fluvial and littoral sedimentary rocks.
Good agreement is seen between LWD and wireline images for sedimentilogical features (bedding and lamination). In addition, reasonable agreement is seen for structural features. However, poor agreement between LWD and wireline geomechanical features may be due to:
- Time lag differences between LWD and wireline: Drilling induced fractures (DIFs) were poorly imaged. This is caused by healing of DIFs following drilling. The features are not threatening wellbore integrity but are an indication that the mud weight is too high which may also have caused hydraulic slowing of rate of penetration and an increase in mud loss to the formation.
- Poor log quality: Caused by borehole shape. However, both breakout and DIFs occur together but may not have been formed simultaneously.
- Incomplete borehole coverage: DIFs missed due to gap between pads. However, the arc width on the borehole of DIFs is greater than the non-imaged gap between the wireline pads, indicating the addition of healing lowering their visibility.
Geomechanical image analysis
In geomechanical modeling, an earth model should be calibrated through back analysis of well data in order to lend credibility to forward predictions. Borehole images showing failure features such as breakout and DIFs provide the best source of information for constraining the far-field stress tensor. Ideally for real-time applications, a pre-well model should be constructed using offset well data and then calibrated while drilling using LWD data to generate an optimum solution for management of wellbore integrity.
The data from Well V were used to construct a pre-well geomechanical model using LWD and wireline image data, compressional & shear slowness and leak-off tests (LOT). A stress polygon for this well was plotted in which a friction coefficient of 0.7 was used to constrain the maximum horizontal stress bounding the strike-slip regime. Superimposed on the stress polygon were two failure lines that delineate the limit of tensile and shear failures at a mud weight of 1.83 SG. Due to high mud weight the wellbore was mostly in tension, resulting in the formation of DIFs.
Conversely, the occurrence of shear failure or breakout will be inhibited by high mud weight except in low strength sections or intervals having high in-situ stress anisotropy. This initial assessment of plausible failure mechanisms is supported by areas bounded by failure lines on the stress polygon for a normal fault regime of which the latter is common in the North Sea.
An abundance of DIFs interspersed with some minor breakouts are visible on the LWD images. The presence of these provides real-time calibration of the pre-well geomechanical model. Using a horizontal stress anisotropy value of 1.17 derived from the stress polygon, the mud weight required to initiate hydraulic fracture and breakout were calculated and plotted with depth. The mud weight used was superimposed on the diagram. In most cases the static mud weight is less than the fracture initiation pressure (FIP), but the equivalent circulating density (ECD) exceeds FIP for most of the interval, resulting in the formation of DIFs during drilling. Borehole breakout developed at several intervals where collapse pressure exceeded mud weight.
The agreement in occurrence of DIF and breakout between pre-well model and measurement is coincidental. In most cases, the pre-well model normally requires substantial adjustment in order to match well measurements. Borehole breakout can be used to ‘fine tune’ the model to match breakout width and the calibrated model can then be used to optimize drilling parameters and performance.
Real-time images
Wellbore instability problems while drilling range from slight (vibration, stick-slip, irregular weight transfer) to severe (stuck pipe, lost circulation, wellbore collapse).
Determining a real time solution is a challenge as the symptoms are often similar but the remedial action very different. Before the advent of high resolution LWD images, insufficient information in real time meant certain features (ledges, spiraling, chemical disequilibrium and unconsolidated sandstone) may have been misinterpreted as borehole stress indicators.
This challenge has been met by the availability of high resolution images while drilling, which can be used in three main ways to aid interpretation:
- Structural interpretation: Accurate dip picking in all wellbore orientations can be used to examine the relationship of bedding to the wellbore, with reference to the pre-well model and to check that geometry-dependent mechanical assumptions are correct. Dips can be used to confirm surface orientations in a seismic model, allowing prediction of approaching pressure and mechanical changes. By adding the sub-seismic detail, pore pressure regime and potential geomechanical settings can be predicted. In addition, smaller scale components such as sandbody geometry can be delineated, allowing pore pressure centroid calculation
- Sedimentary interpretation: Identification of lithology and fabrics allows comparison with analogous environments. These are particularly useful where there is an offset core from which measured rock strength properties may be used to refine the pre-well model. Successful identification of thin beds or inter-sandstone mudrock layers will enhance the understanding of potential pressure compartmentalization and differentiating them from borehole problems (ledging and spalling)
- Geomechanical features: The identification of breakout, DIFs, enhancement of natural fractures and shear plane failures indicate how the formation (and the borehole) is reacting to the drilling process and their magnitude can be compared to the pre-well model. These features are the most critical for determining changes to drilling parameters.
Real-time images in wellbore integrity management
The pre-well model incorporates features which identify potential drilling hazards, also including offset well logs, seismic models and core data. Following this, a well logging program can be designed to deliver sufficient real-time data, including images, to identify wellbore integrity issues. These include at least gamma ray and resistivity logs for correlation with offsets, a compressional acoustic measurement and a high resolution image for identification of geomechanical features. Formation pressure measurements are useful for calibration of the pore pressure model.
The logging requirements then dictate the BHA design, drilling parameters, and contingency logging options which will include an assessment of likely wellbore instability problems. The well program allows drillers to make wellbore stability decisions up to a pre-defined limit.
Understanding of the differences between the application of while-drilling and wireline imaging measurements allows us to use both appropriately where we see good use for LWD images in the real-time domain and wireline images in the pre-well modeling domain.
Acknowledgments
The authors thank Jose Cabrera and Chris Wolf for their input to this paper. Additionally we thank the operator for allowing data usage.
Editor’s Note: This is a summary of a paper presented at the 2007 SPE/IADC Drilling Conference in Amsterdam, The Netherlands, Feb. 20-22, 2007.


